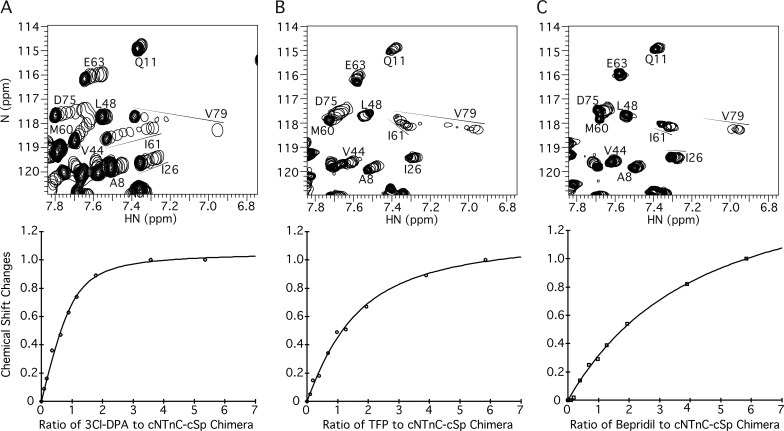
Figure 5.
Titrations of 3-Cl-DPA, TFP, and bepridil into Ca2+-saturated cNTnC–cSp chimera. (A–C) Titrations of 3-Cl-DPA (A), TFP (B), or bepridil (C) into 15N-labeled cNTnC–cSp chimera, as observed by 2D [1H,15N]-HSQC NMR spectra (amide HN 1H chemical shift plotted along x axis, amide 15N chemical shift plotted along y axis). For each titration, all spectra have been overlaid, with peaks plotted as a single contour level so that their progression can be tracked (shown by arrows). The final spectrum at the end of the titration is plotted conventionally with multiple contour levels. Below each spectrum is a representative plot of chemical shift changes as a function of compound added, from which Kd is calculated. Note that the ratio of compound to cNTnC–cSp chimera, rather than the absolute concentration of compound, is on the x axis. This is because plots of saturation versus compound concentration are typically performed when the protein concentration is much smaller than the Kd. However, because of the sensitivity limitation of multidimensional solution NMR, the protein concentration (0.11 mM) is greater than the Kd (10 µM in the case of 3-Cl-DPA). Thus, to avoid confusion, the protein/compound ratio is used instead.

