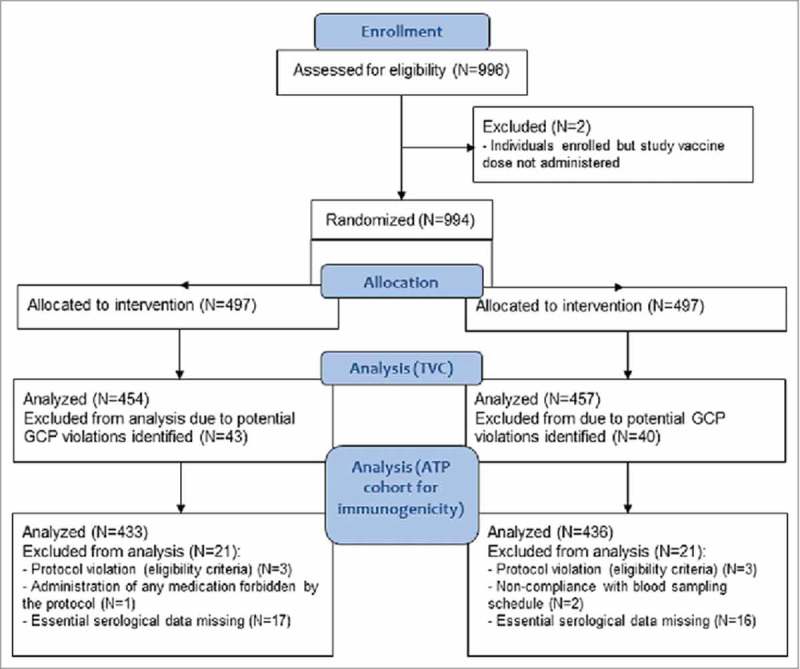
Figure 2.

Flow diagram of the study participants. Footnote: N, number of participants; n, number of participants within the category; GCP, good clinical practice; TVC, total vaccinated cohort; ATP, according-to-protocol.

Flow diagram of the study participants. Footnote: N, number of participants; n, number of participants within the category; GCP, good clinical practice; TVC, total vaccinated cohort; ATP, according-to-protocol.