
Figure 1.
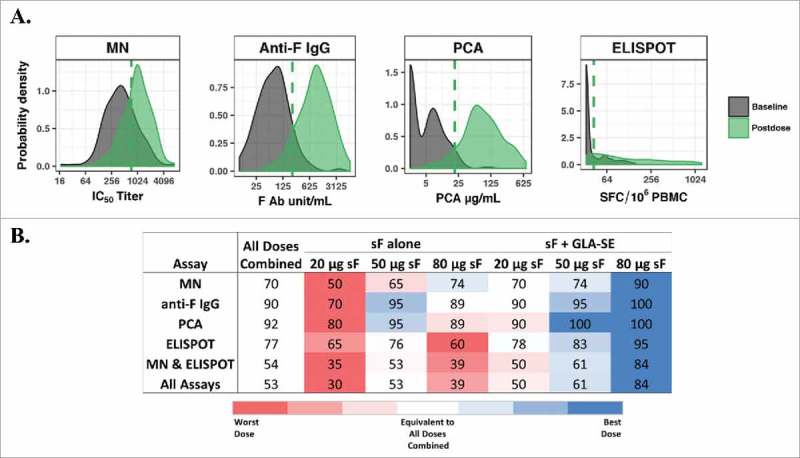
Youden index (YI) threshold method. (A) Probability distribution curves of overall baseline levels and postvaccination levels from RSV sF 20, 50, or 80 μg ± 2.5 µg GLA-SE plotted on the log-scale. The dashed line represents the YI threshold value for each biomarker. Threshold values and (baseline percentile) for MN IC50 titer = 739.2 (76%); anti-F IgG = 221.6 units/mL (91%); PCA = 20.7 µg/mL (96%), and ELISPOT = 42.2 SFC/106 PBMC (74%); (B) Percentage of subjects with postvaccination values greater than or equal to the threshold value for each assay or simultaneously for multiple assays. The values for all doses combined are used as a benchmark (white background), and percentages from individual doses are presented in red (lower than), white (equivalent to) and blue (higher than) all doses combined. Red and blue gradients represent the strength of the difference, with the darkest color representing the greatest difference. Ab, antibody; ELISPOT, enzyme-linked immunospot; GLA-SE, glucopyranosyl lipid adjuvant-stable emulsion; IgG, immunoglobulin G; MN, microneutralizing antibody; PBMC, peripheral blood mononuclear cells; PCA, palivizumab-competitive antibody; RSV, respiratory syncytial virus; sF, soluble fusion protein; SFC, spot-forming cells.