
Figure 2.
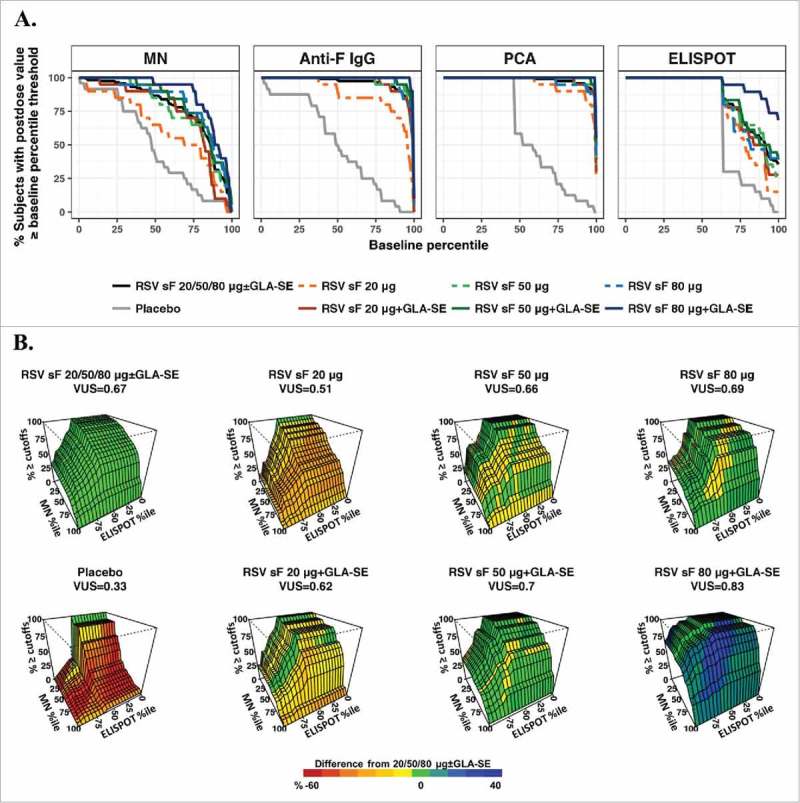
ROC-B method. (A) ROC curves for individual assays. The x-axis represents baseline percentiles and the y-axis is the probability that the postvaccination response was greater than or equal to the baseline percentile threshold. The ROC curve is shown for each formulation and combined arms of 20, 50, or 80 μg of RSV F protein ± GLA-SE; (B) Three-dimensional ROC surface plot for the combination of results from the MN and ELISPOT assays compared to baseline values from all arms combined. The x-axis and y-axis are baseline percentiles for ELISPOT and MN data, respectively, and the z-axis is the percentage of postvaccination values greater than or equal to both the MN and ELISPOT baseline percentile thresholds. The ROC surface is shown for each formulation and for the combination of all (20, 50, and 80 μg) dosage levels of sF combined ± 2.5 µg GLA-SE. The ROC surface for the all doses combined is shown in green and used as a benchmark, and the ROC surface for each individual formulation is shown in red, green and blue representing values on the z-axis lower than, equivalent to and higher than the benchmark ROC surface. ELISPOT, enzyme-linked immunospot; GLA-SE, glucopyranosyl lipid adjuvant-stable emulsion; IgG, immunoglobulin G; MN, microneutralizing antibody; PCA, palivizumab-competitive antibody; ROC, receiver-operating characteristic; ROC-B, receiver-operating characteristic relative to baseline; RSV, respiratory syncytial virus; sF, soluble fusion protein.