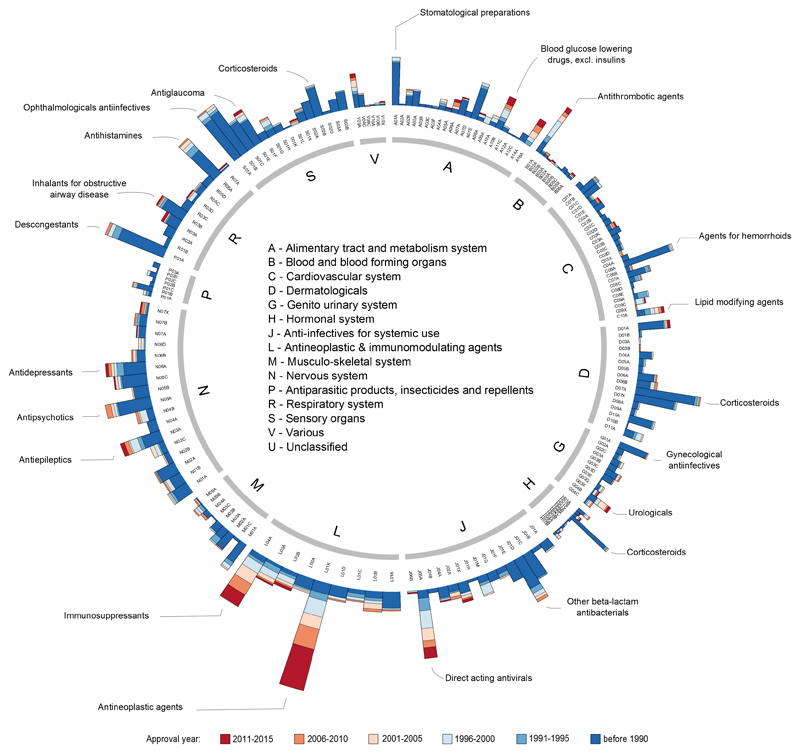
Figure 2.
Innovation patterns in therapeutic areas. Each node in the inner ring corresponds to a drug represented by its ATC code(s). The inner ring corresponds to the level 1 of the ATC code (see Table 2) scaled to the number of drugs in that category. The outer ring represents the level 3 of the ATC code. Each of the subsequent histograms illustrates the number of drugs (small molecules and biologics) distributed per year of first approval per level 3 of the ATC code. Max histogram scale: 100. The approval year refers to the first known worldwide approval date, if available, otherwise the first FDA approval date.

