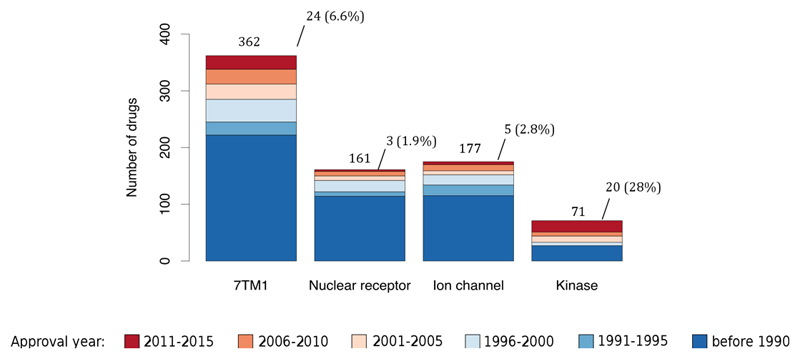
Figure 3.
Innovation patterns in privileged protein classes. Histogram depicting the number of drugs (small molecules and biologics) that modulate the four privileged families, distributed per year of first approval. On top of each bar, the total number of approved drugs is shown, together with the number and percentage of drugs approved since 2011 in respect to the total drugs modulating these four families. A spreadsheet view of this data is provided in supplementary information S6 (table). 7TM1: G-protein coupled receptor 1 family; Ion channel: Voltage-gated ion channel and Ligand-gated ion channel. Drugs without an ATC code (U – Unclassified) were excluded from this analysis.

