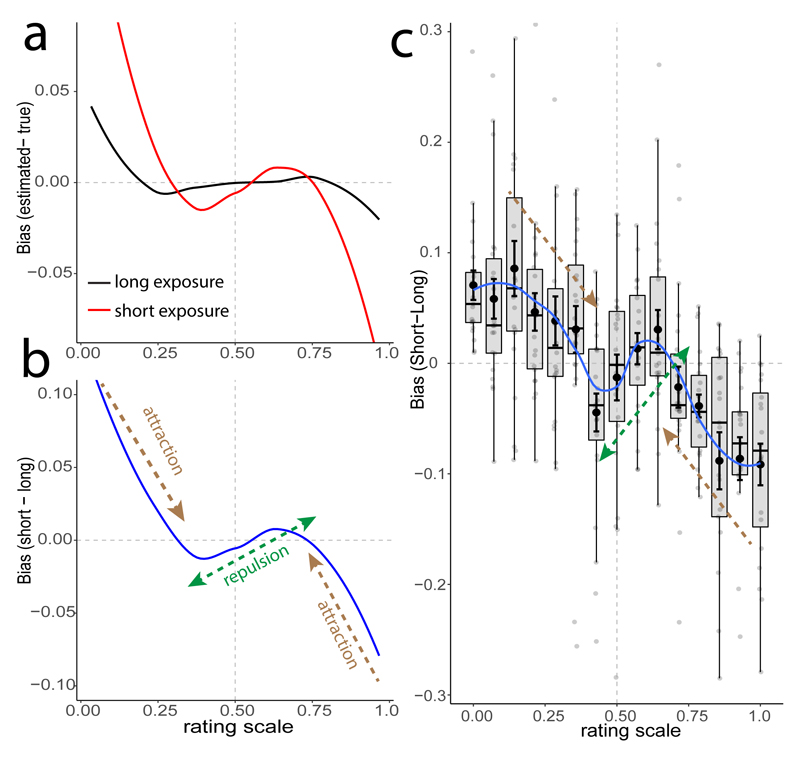
Figure 3. Illusion of preference (Experiment 3).
a) Model-predicted biases for two degrees of internal measurement noise (σ) during subjective-value estimations: high (red, generated by short valuation exposure) and low (black, generated by long valuation exposure). b) Model-predicted differences of the biases for high and low σ across the value rating scale. c) Difference of the empirical estimates between low and high exposure times (n=24, mean data are black dots with s.e.m. across participants, blue line interpolates these data for visualization). Note the qualitative and quantitative overlap with the model prediction in panel b. This suggests that human valuation exhibits complex illusions of subjective preference, as predicted by the Bayesian and efficient coding hypothesis (see also Supplementary Fig. 7). Lower and upper boxplot hinges correspond to the 25th and 75th percentile and each semitransparent dot represents the data of one participant.

