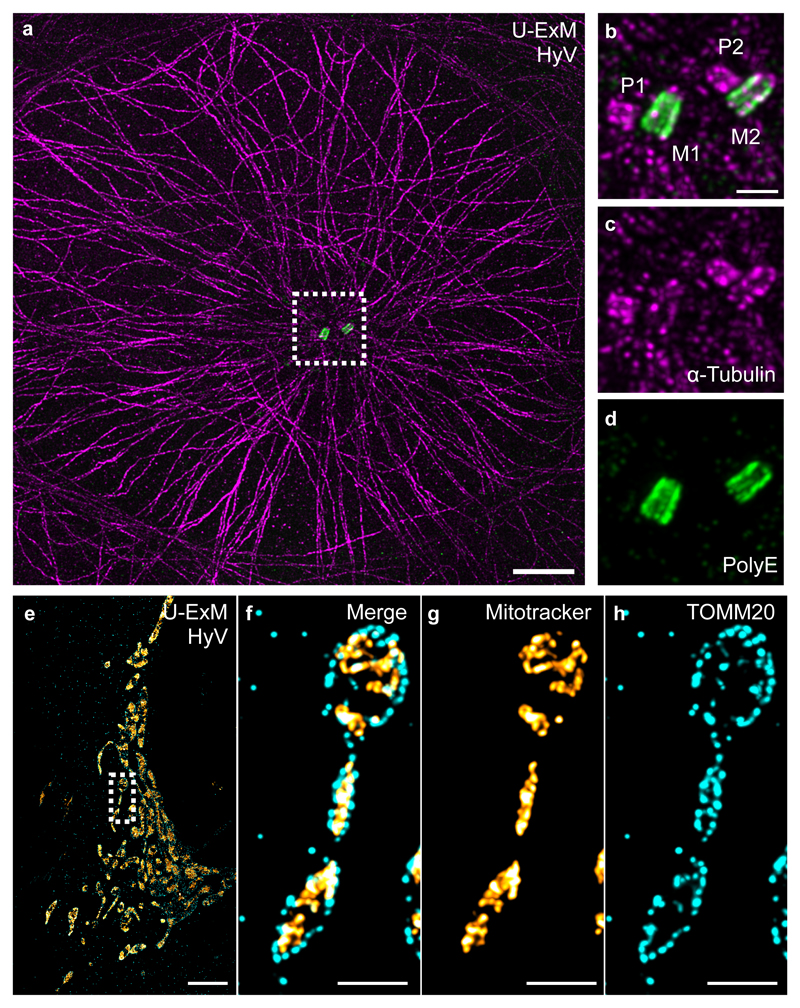
Figure 3. U-ExM applied on human cells.
(a) Representative Hyvolution confocal image of a U2OS cell fixed with methanol, expanded with U-ExM, and stained for α-tubulin (magenta) and PolyE (green). Scale bar: 10μm. (b-d) Insets (dotted square in a) show the centriolar pair, P: procentriole, M: mature centriole. Scale bar: 2μm. Representative images from 3 independent experiments. (e-h) Representative Hyvolution confocal image of a U2OS cell fixed with PFA/GA and stained for MitoTracker (orange) and the outer membrane mitochondrial translocase TOMM20 (cyan). Scale bar: 12μm. The dotted square shows a zoom of the highlighted region. Note that as expected TOMM20 signal is surrounding the MitoTracker signal. Scale bar: 3μm. Representative images from 1 experiment.

