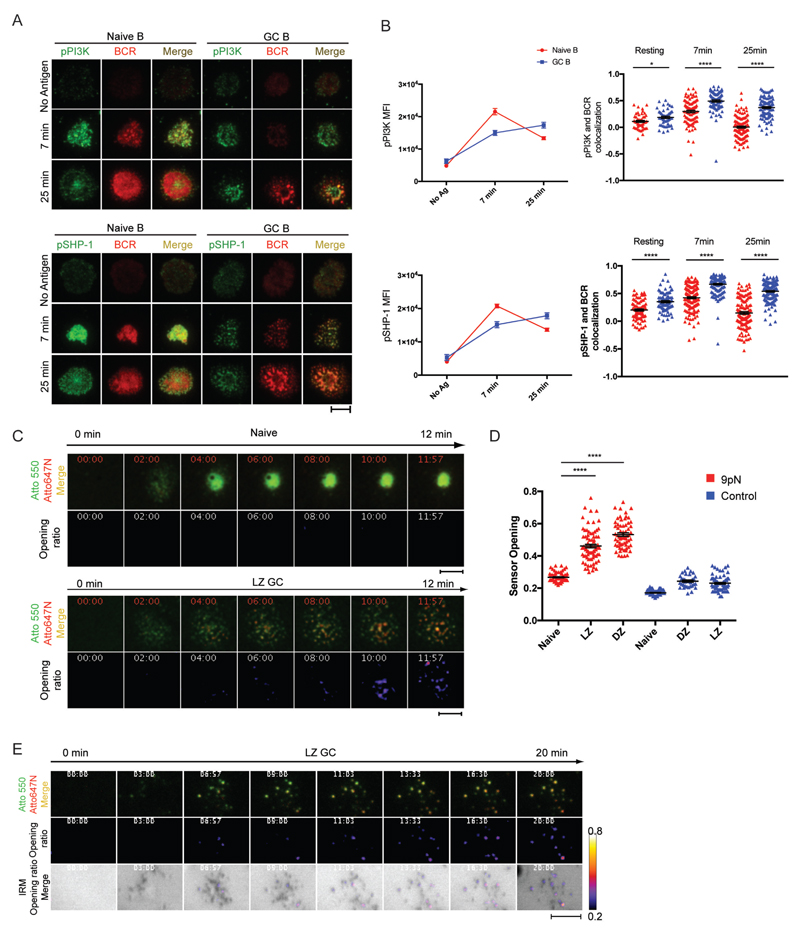
Figure 2.
Human GC B Cells Signal in Response to and Exert Pulling Forces on Membrane Bound Antigens through Pod-like Structures. (A) Immune synapses of naïve B cells and GC B cells imaged by TIRFM on PLB containing F(ab')2 anti-λ/κ. (B) MFI of pPI3K and pSHP-1 and colocalization of BCR with pPI3K or pSHP-1 in the contact area of naïve and GC B cells placed on antigen-containing PLBs for 7 or 25 min. (C) (Top panels) Atto 647N FI (red) and Atto 550 (green) merged images. (Bottom panels) Sensor opening ratio (the ratio of Atto 647N FI to Atto 550 FI). (D) Quantification of sensor opening control sensors. (E) Colocalization of sensor opening locations and contact sites to the membrane with time imaged by TIRFM and IRM. Scale bars are 5µm. ns>0.05, *P≤0.05, **P≤0.01, ***P≤0.001, and ****P≤0.0001 (unpaired t-test). Data are representative of two experiments. (B and D: mean and s.e.m.)

