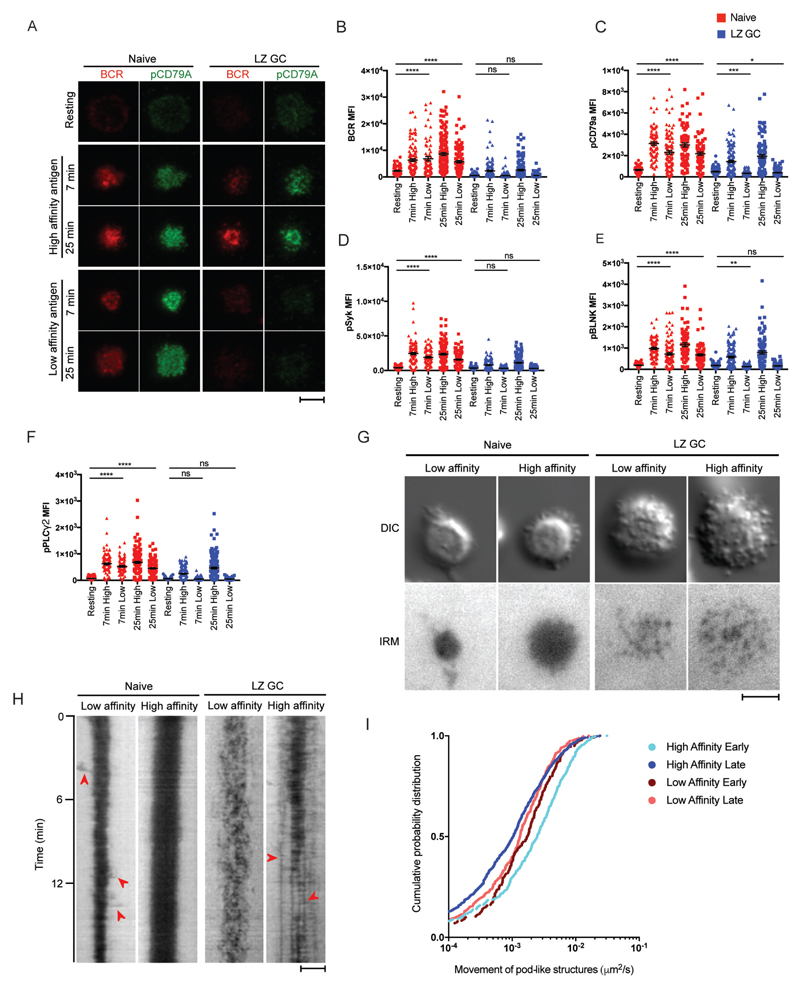
Figure 3.
Human GC B Cells Have a High-Affinity Threshold for Antigen. Naïve and LZ GC B cells were placed on PLB that did not contain antigen (resting) or placed on PLB that contained either high-affinity or low-affinity anti-κ mAbs. (A) TIRFM images were obtained of cells stained for the BCR and pCD79A. (B-C) Quantification of the BCR (B) and pCD79A (C) in the contact area of the B cells with the PLB in TIRFM images. (D-F) Quantification of TIRF images of cells stained with pSyk (D), pBLNK (E) and pPLCγ2 (F) in the contact area with the PLB of naïve and LZ GC B cells activated by high and low-affinity antigen for 7 or 25 min. (G) DIC and IRM images of naïve and LZ GC B cells imaged by TIRFM on PLB containing either high-affinity or low-affinity anti-κ mAbs. The still images were taken between 3 to 12 min of the supplementary movie 6. (H) Kymographs of IRM images of naïve and LZ GC B cell immune synapse on low- or high-affinity antigen-containing PLB. Red arrow heads on low-affinity naïve B cell are extended membrane ruffles and on high-affinity LZ GC B cell are pod-like structures established stable contacts to antigen-containing PLB. (I) Quantitative analysis of pod-like structure movement in DIC images (number of tracks: n= 347 for high affinity early, n=887 for high affinity late, n=241 for low affinity early, and n=432 for low affinity late). Scale bars are 5µm. ns>0.05, *P≤0.05, **P≤0.01, ***P≤0.001, and ****P≤0.0001 (unpaired t-test). Data are representative of two experiments. (B-F: mean and s.e.m.)

