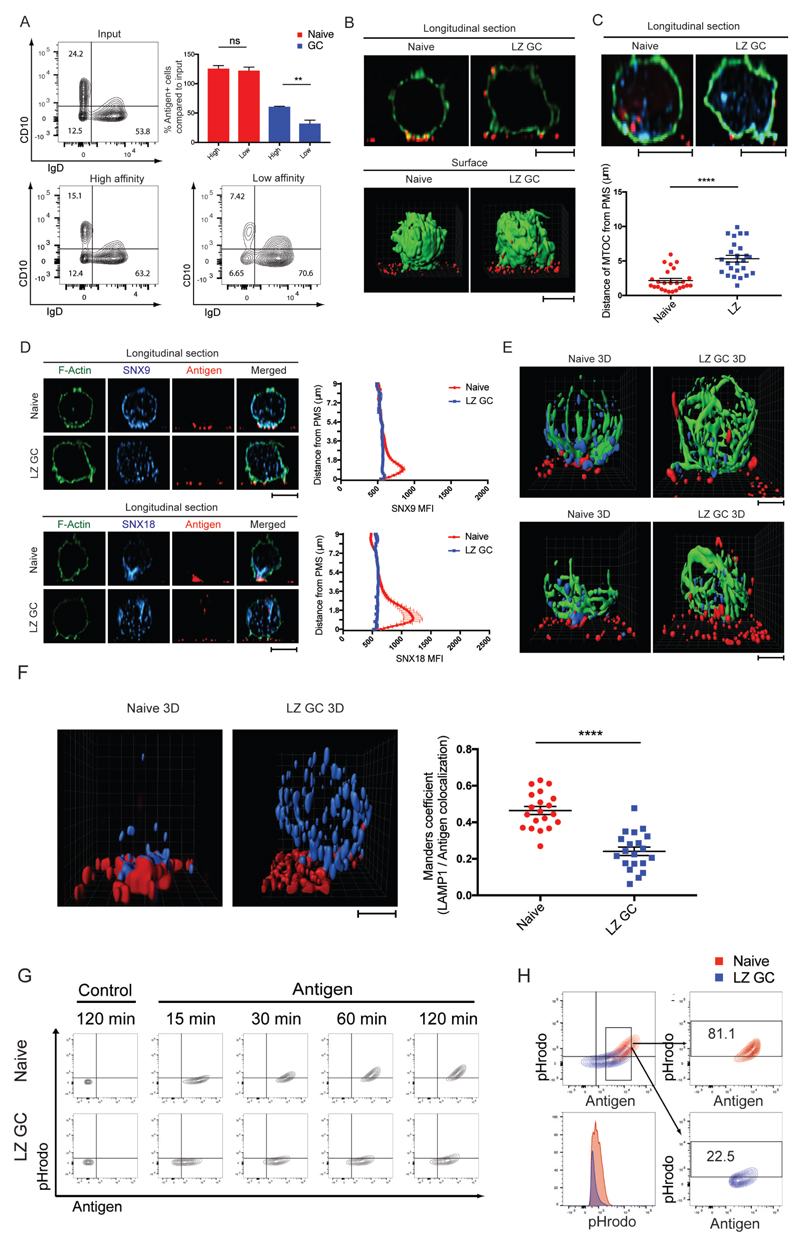
Figure 4.
Extraction and Trafficking of Membrane Associated Antigen Distinguishes GC B cells. (A) Antigen extraction by naïve and GC B cells placed for 2 h on PMS that contained either high-affinity or low-affinity anti-κ mAbs. Antigen-positive B cell populations were quantified by flow cytometry. (B) Transport of extracted antigens in naïve and LZ GC B cells placed on antigen-containing PMS. F-actin (green) and antigen (red). (C) Distance of MTOC in naïve and LZ GC B cells to antigen-containing PMS. F-actin (green), gamma-tubulin (cyan), antigen (red). (D) Localization and quantification of SNX9 or SNX18 in naïve and LZ GC B cells 45 min after activation on antigen-containing PMS imaged by confocal microscopy. F-actin (green), SNX9 and SNX18 (cyan), and antigen (red). MFI of SNX9 and SNX18 per each z-stack from the cell bottom to the top (n=25 per group). (E) Localization of SNX9 or SNX18 with MTOC in naïve and LZ GC B cells 45 min after activation on antigen-containing PMS. Alpha-tubulin (green), SNX9 and SNX18 (cyan), and antigen (red). (F) Localization pattern of LAMP-1 in naïve and LZ GC B cells (left) 30 min after activation on antigen-containing PMS. 3D colocalization of antigen with LAMP-1 in naïve and LZ GC B cells (right). LAMP-1 (cyan) and antigen (red). (G) Trafficking of extracted antigens to acidic intracellular compartments in naïve and LZ GC B cells with time on antigen-containing PMS. (H) Percentage of antigen-positive and pHrodo intensities (bottom left) of naïve B cells and LZ GC B cells which are similar in their antigen acquisition. ns>0.05, *P≤0.05, **P≤0.01, ***P≤0.001, and ****P≤0.0001 (unpaired t-test). Data are representative of two (B-F) or three experiments (A, G, and H). (A, C, D and F: mean and s.e.m.)

