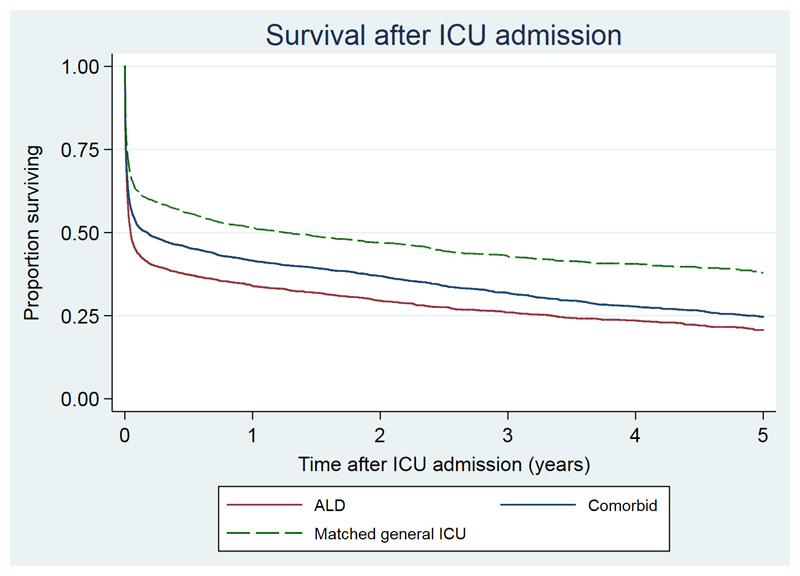
Figure 2. Kaplan-Meier plot of survival in ALD cohort compared with comparator cohorts with other severe comorbidities and matched general ICU patients from time of ICU admission.
| Years | 0 | 1 | 2 | 3 | 4 |
| ALD | 2463 | 730 | 522 | 361 | 231 |
| Comorbid | 3590 | 1337 | 996 | 649 | 410 |
| General ICU | 2391 | 1043 | 766 | 479 | 304 |

