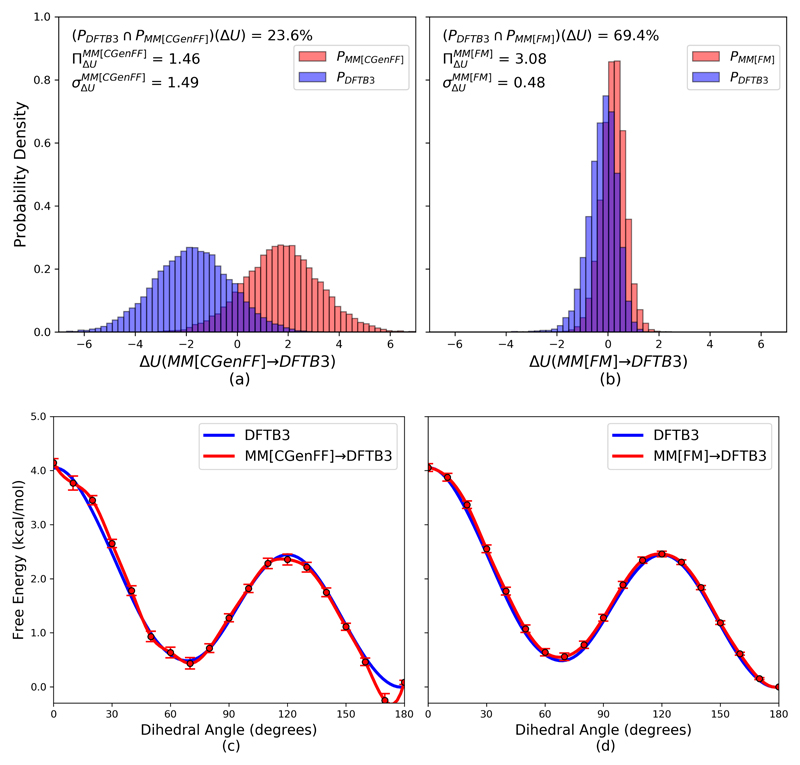
Figure 2.
(a) Gas-phase butane potential energy difference histograms between a high level DFTB3 (PDFTB3 configurations) ensemble and a MM[CGenFF] (PMM[CGenFF] configurations) low level ensemble. (b) Gas-phase butane potential energy difference histograms between a DFTB3 and a MM[FM] (PMM[FM] configurations) low level ensemble. Histograms (PDFTB3, PMM[CGenFF], and PMM[FM]) were generated using 20,000 configurational snapshots from a 2 ns LD simulation. (c) Comparison of the gas-phase butane dihedral potential of mean force (PMF) generated with FEP using MM[CGenFF] as the low level of theory (ΔAMM[CGenFF]→DFTB3) using data from 1 ns of LD (10,000 points every 10°, red) to a reference DFTB3 PMF generated with MBAR (10,000 points every 10°, blue). (d) Comparison of the gas-phase butane dihedral potential of mean force (PMF) generated with FEP, but using using MM[FM] as the low level of theory (ΔAMM[FM]→DFTB3) using data from 1 ns of LD (10,000 points every 10°, red) compared to the reference DFTB3 PMF (blue).

