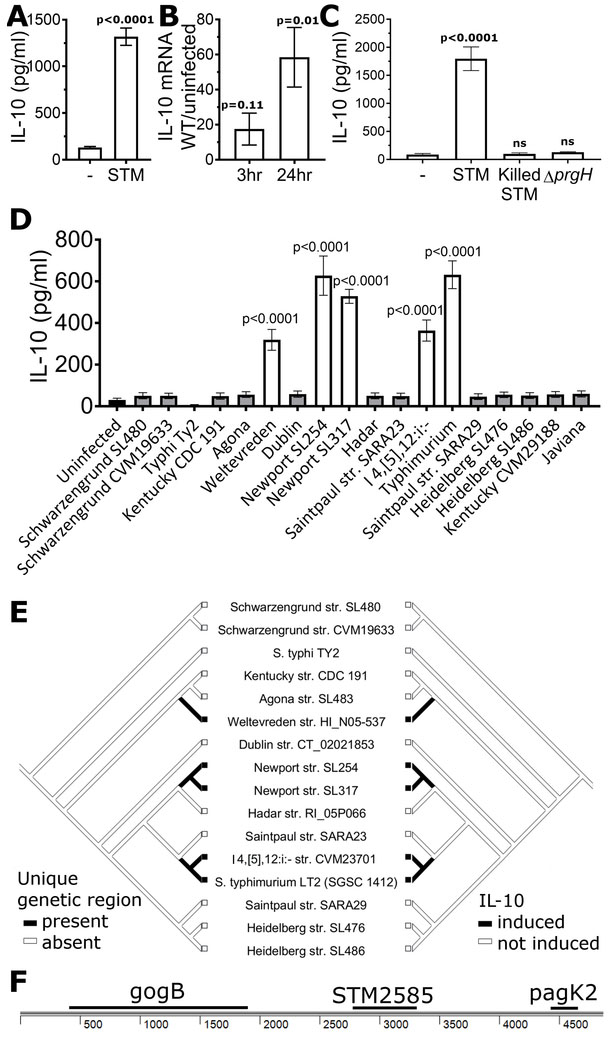
Figure 1: S. enterica Typhimurium and other serovars induce IL-10.
a, S. Typhimurium induces secretion of IL-10. LCLs (GM19154) were infected with S. Typhimurium (STM) at MOI30 and IL-10 in supernatant measured after 24 hrs. b, S. Typhimurium induces IL-10 at the transcriptional level. IL-10 mRNA levels were measured using Taqman assay of LCLs (GM19154) with and without S. Typhimurium infection. For a-b, graphs are from 8-9 biological replicates measured in 3-4 separate experiments. c, S. Typhimurium induction of IL-10 in LCLs (GM19203) requires living, intracellular S. Typhimurium. Heat-killed S. Typhimurium or live S. Typhimurium unable to invade (ΔprgH) do not induce IL-10 above uninfected levels. 7-10 biological replicates measured in 3 experiments. d, S. enterica strains exhibit variation in their ability to induce IL-10. LCLs (GM19203) were infected with sequenced S. enterica serovars at MOI30, and IL-10 in supernatant measured after 24 hrs. Only serovars Weltevreden, Newport, I 4,[5],12:i:-, and Typhimurium induced IL-10. Data for each strain are from at least 6 biological replicates measured in 3 experiments. Levels of pyroptosis, a SPI-1 dependent process, are shown in Figure S1. e, A mirror tree of S. enterica strains based on the phylogeny from (Fricke et al., 2011) illustrates the presence of a 4869 bp region only in strains able to induce IL-10. f, A 4869bp region containing 3 known protein-coding regions is unique to IL-10-inducing serovars. P-values in Figures 1A and 1B were calculated using unpaired student’s t-test and in Figures 1C and 1D using ANOVA with Sidak’s multiple comparison post-hoc test; error bars represent SEM.

