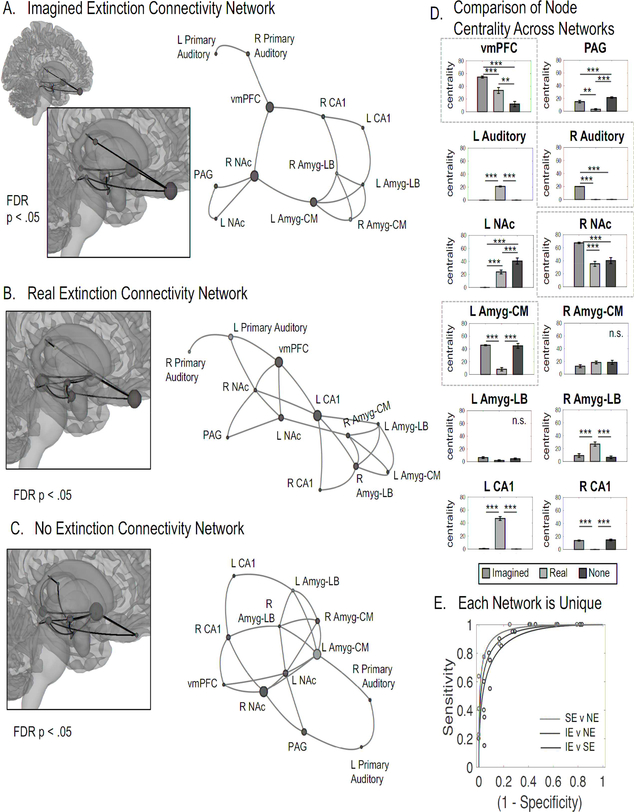
Figure 4. Neural Networks Supporting Extinction Learning.
Functional connectivity between a priori regions of interest (vmPFC, hippocampus (CA1), laterobasal amygdala (Amg-LB), central nucleus of the amygdala (Amyg-CM), NAc, PAG, and the primary auditory cortex) across the entire extinction session was investigated without a contrast. Links are plotted if the partial correlation test between two nodes was significant after FDR correction within each group. The link length between each pair of nodes is related to the absolute value of the t-statistic associated with the partial correlation between each pair, however, link length is a graphical representation of this value, adjusted to exist in a 2D space. Here, shorter links represent greater functional connectivity. The size of each node represents betweenness centrality, which is the number of shortest paths that pass through the node, rescaled for plotting purposes with a sigmoid function. Node colors indicate clusters determined by ward linkage. A. Imagined Extinction Connectivity Network. The most central nodes (i.e., nodes most connected with other nodes) of the imagined extinction network included the right Nac, vmPFC, left Amg-CM, and right Primary Auditory Cortex. B. Real Extinction Connectivity Network. The most central nodes of real extinction included the left CA1, vmPFC, and right Nac. C. No Extinction Connectivity Network. The most central nodes during the no extinction, unrelated imagination included left NAc, left Amyg-CM, and right NAc. D. Comparison of Nodal Centrality Across Networks. 10 out of 12 nodes yielded group significant differences in betweenness centrality in a one-way ANOVA test, FDR corrected for multiple comparisons (p < 0.05). Data are represented as mean ± SEM Asterisks represent pairwise significant difference via a post hoc t-test. The most central nodes to imagined extinction are indicated by a dashed box. E. Each Network is Unique. In order to test the separability of each matrix, and thereby assess their relative similarity, we trained three different binary linear support vector machine classifiers on participant connectivity data (the partial correlations between each pair of nodes). Leave-one-out cross-validated accuracy scores revealed that each group was linearly separable from one another with high accuracy (Real v None: 91% +− 4.2% STE; Imagined v None: 89% +− 4.8% STE; Imagined v Real: 88% +− 5.0% STE).

