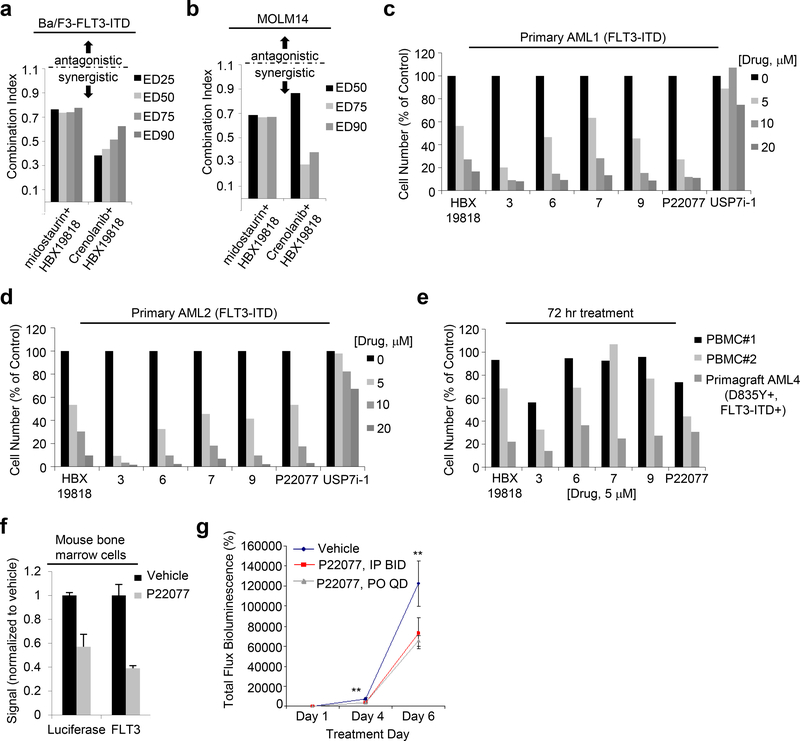
Figure 6. Effects of combination of HBX19818 with FLT3 kinase inhibitors and targeted effects of USP10 inhibition on mutant FLT3-positive AML primary cells in vitro and in vivo.
(a) Combination indices corresponding to co-treatment of Ba/F3-FLT3-ITD cells with midostaurin or crenolanib with HBX19818. (n=2) (b) Combination indices corresponding to co-treatment of MOLM14 cells with midostaurin or crenolanib with HBX19818. (n=2) (c-d) Effects of DUB inhibitors on FLT3-ITD-expressing primary AML patient cells following approximately 72 hrs of treatment. (n=2). (e) Effects of USP10 inhibitors on normal PBMCs versus mutant FLT3-expressing AML primagraft cells (D835Y+, FLT3-ITD+) following 72 hours treatment. (n=2). (f) Correlation between luciferase-positive leukemia burden as measured by Bright Glo assay and luminoskan (left panel) and percent FLT3 as measured by flow cytometry using a CD135-PE conjugated antibody (right panel) in bone marrow samples from vehicle- versus P22077 (50 mg/kg, IP BID)-treated mice (pilot study, 4 day treatments). (n=3). (g-h) Effect of P22077 treatment on Ba/F3-FLT3-ITD-luc+ cell growth in a non-invasive in vivo bioluminescence model of leukemia. (n = 7–8) Left panel: Total flux bioluminescence plotted as a graph. Error bars represent the standard error of the mean. Right panel: Bioluminescent images of representative mice with matched starting leukemia burden. Student t-test (two-sided): Vehicle vs IP BID: Day 4 (p=0.0069212), Day 6 (p=0.1033934). Vehicle vs PO QD: Day 4 (p=0.0034501), Day 6 (p=0.0425383).

