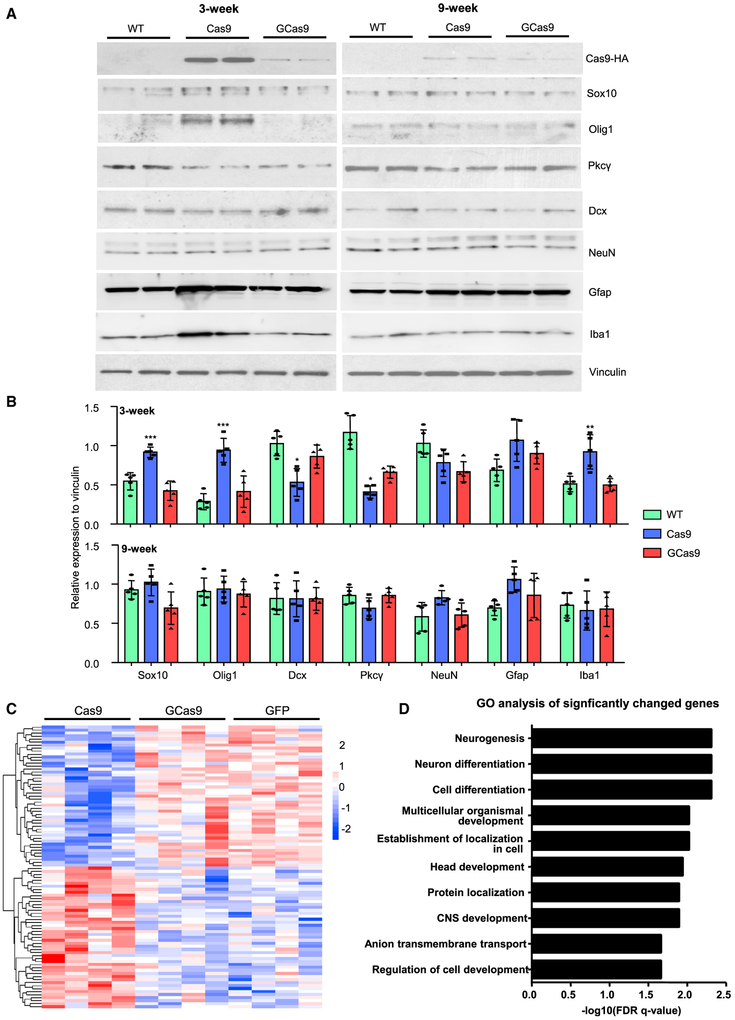
Figure 4. Validation of RNA-Seq Results.
(A) Western blotting analysis was performed to compare the expression of selected proteins in the striatum 3 or 9 weeks after AAV-Cas9 or AAV-GCas9 injection. Vinculin was used as a loading control.
(B) Quantitative analysis of western blotting results in (A) (n = 5; *p < 0.05; **p < 0.01; ***p < 0.001; one-way ANOVA with Tukey post-tests).
(C) Heatmap view of 94 significantly changed genes in AAV-Cas9-injected striatal tissues compared with AAV-GFP- or AAV-GCas9-injected striatal tissues (n = 4; p < 0.05).
(D) GO analysis was performed on the 94 significantly changed genes. The top 10 pathways with the lowest FDR were shown. Data are represented as mean ± SEM. See also Figure S3.

