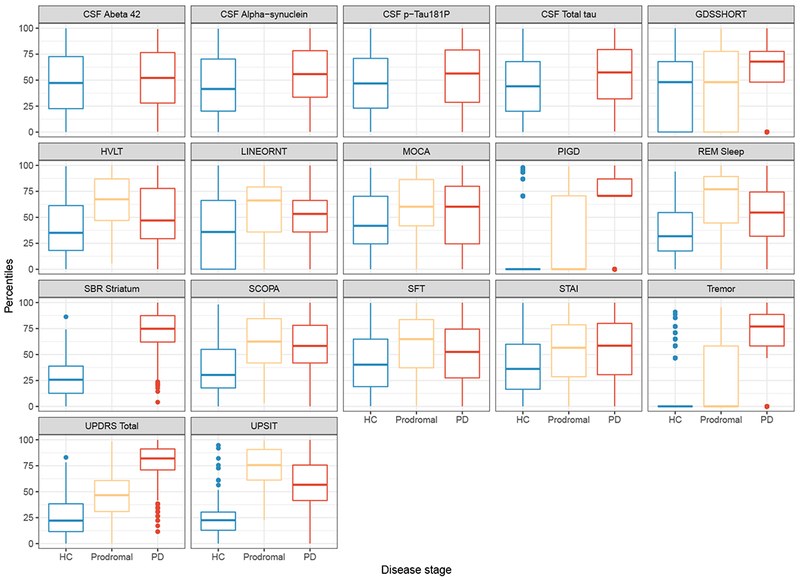
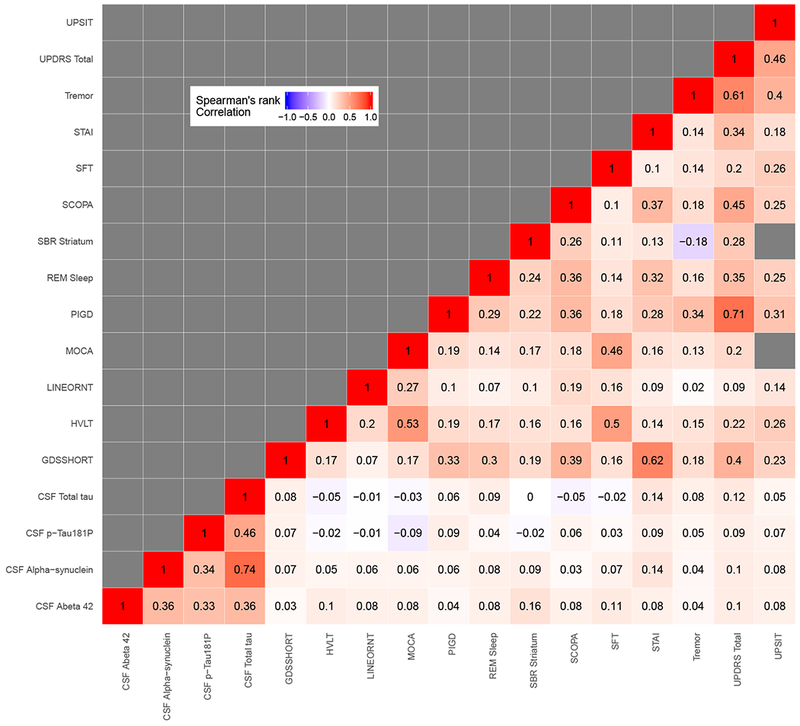
Figure 1:


(a) Box-plot
(b) Correlation matrix
Box-plot and Correlation Matrix: The left panel shows box-plots of the observed quantiles of each outcome by disease category. The right panel shows Spearman’s correlation between the outcomes.
Abbreviations: PIGD, Posture Instability and Gait Difficulty; RBD, REM sleep behavior disorder; UPSIT, University of Pennsylvania Smell Identification Test; MOCA, Montreal Cognitive Assessment; HVLT, Hopkins Verbal Learning Test; GDS, Geriatric Depression Scale; SFT, Semantic Fluency Test; SCOPA, Scale for Outcomes in Parkinson’s; LINEORT, Line Orientation Test; UPDRS, Unified Parkinson Disease Rating Scale; STAI, State Trait Anxiety Index; PD, Parkinson Disease; HC, Healthy Control.
