
Figure 1.
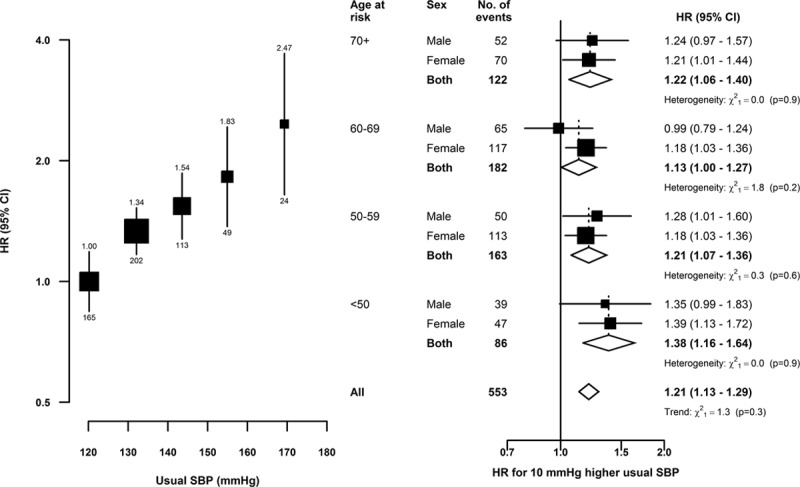
Subarachnoid hemorrhage vs usual systolic blood pressure (SBP), by age and sex. Hazard ratios (HR) adjusted for age at risk, sex, area, education, smoking, alcohol intake, and body mass index. Left, the area of each square is inversely proportional to the variance of the category-specific log risk; (right) it is inversely proportional to the variance of the log(HR). Corresponding 95% CIs are plotted as lines. Each diamond is the inverse-variance weighted average of the 2 estimates for men and women. Regression dilution ratios: (left) 0.58; (right) by sex and age, for men: 70+ (0.52), 60−69 (0.54), 50−59 (0.59), and <50 (0.62) y, and for women: 70+ (0.57), 60−69 (0.59), 50−59 (0.63), and <50 (0.67) y.