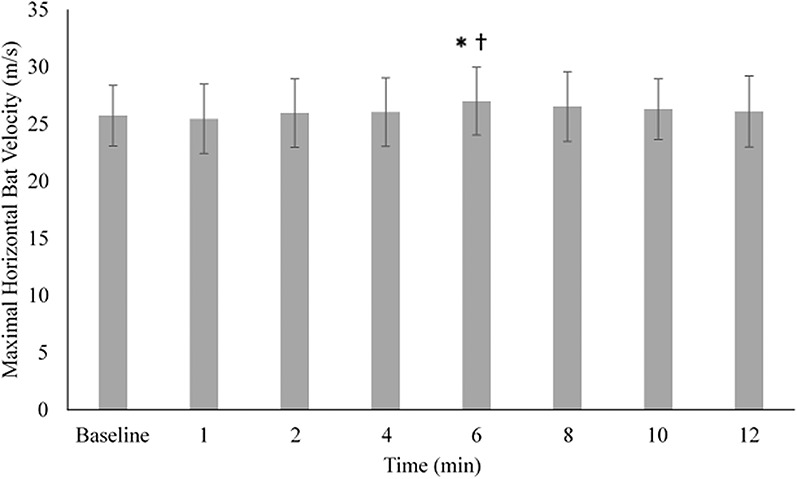
Figure 2.

A graphical comparison of average bat velocity during the pre– and post–warm-up swing trials. Error bars are set at mean SD. *Indicates that the results are significantly different from baseline bat velocity (p < 0.05). †Indicates that the results are significantly different from 1-minute post–warm-up bat velocity (p < 0.05).
