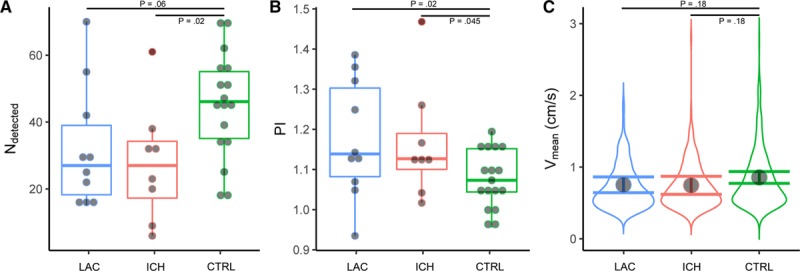
Figure 4.

Semioval center (CSO) measurements. The horizontal axes show patients with lacunar infarction (LAC, in blue), with deep intracerebral hemorrhage (ICH, in red) and controls (CTRL, in green). The horizontal bars indicate the comparisons for which the P values are listed. A, Shows boxplots of the number of detected perforators. B, Shows boxplots of the pulsatility index (PI). The boxplots show interquartile ranges with markers for each participant. C, Shows the probability density distribution of blood flow velocity (Vmean) of all detected CSO perforators of all participants in a group. The marker shows the blood flow velocity as fitted by the linear mixed effects model, with its 95% CI shown by error bars.
