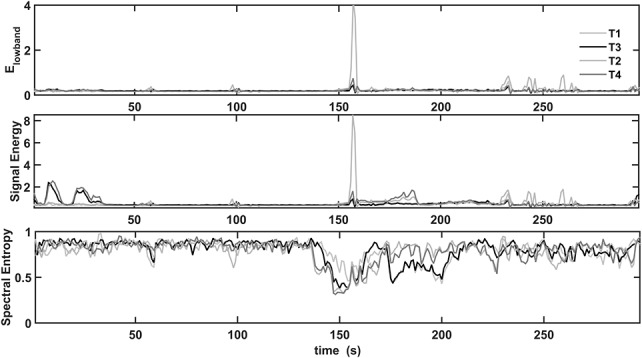
FIG. 4.

Prominent features extracted from the P1_s1 seizure recording. Elowband, signal energy, and spectral entropy changes appear at the electrical and clinical onset of seizure, 138 and 180 seconds, respectively. The profiles of Elowband and signal energy measures are alike until the electrical onset. Emidband and Ehighband contribute to the total energy only after the clinical onset of the seizure. The spectral entropy changed most at the electrical onset and contributed most to the detection of the electrical onset.
