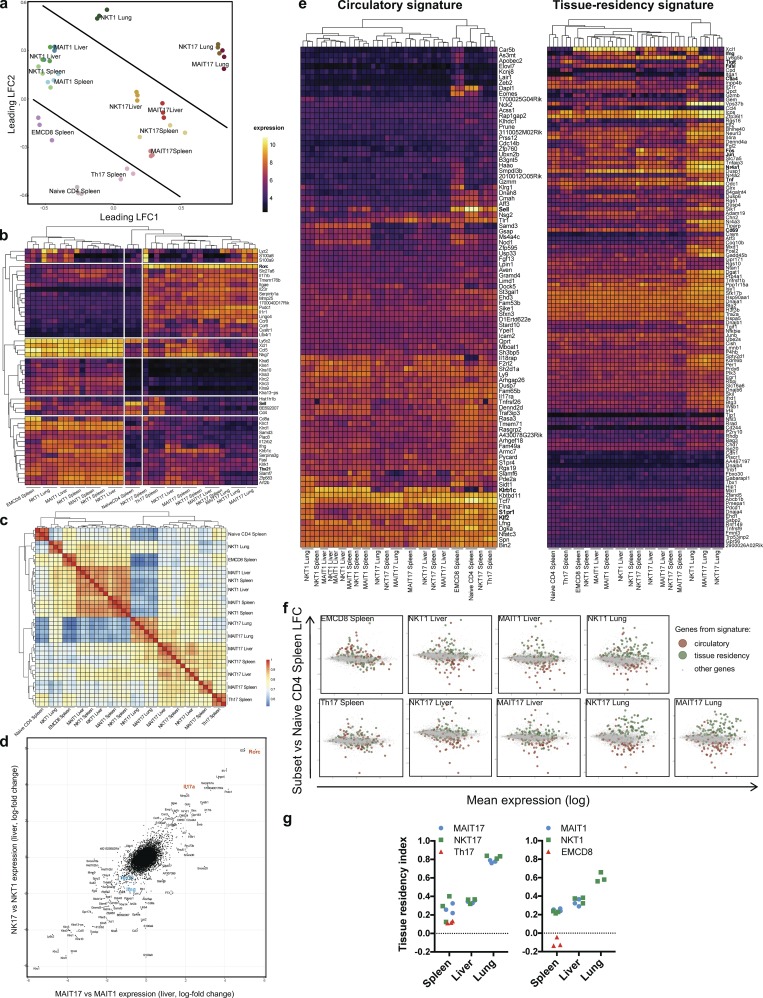
Figure 2.
NKT and MAIT subsets share a similar transcriptional program associated to tissue residency in peripheral organs. Gene expression of FACS-sorted subsets of MAIT, NKT, and conventional T cells was evaluated by microarray (Affymetrix) in triplicates (each replicate from pooled mice). (a) MDS scatter plot based on the 10% most variable transcripts, summarizing the euclidean distances between the cell subsets. (b) Heat map and unsupervised hierarchical clustering based on the expression of the top 50 most variable genes between samples. (c) Heat map representation and hierarchical clustering based on a correlation matrix (Pearson coefficient) from the gene expression values. (d) Scatter plot of gene expression ratios (lfc) of the type 17 and type 1 subsets in the liver illustrating the relationships between NKT and MAIT subsets. (e) Heat map and hierarchical clustering showing the expression level of genes associated to circulatory and tissue residency signatures (from Milner et al., 2017). Numerical values are depicted in Table S3. (f) Mean-difference scatter plots showing the expression ratio (lfc) of genes associated to the circulatory and tissue residency Runx3 signatures, as compared with naive CD4+ T cells. (g) Tissue residency index (see Materials and methods) evaluated in the different cell subsets.

