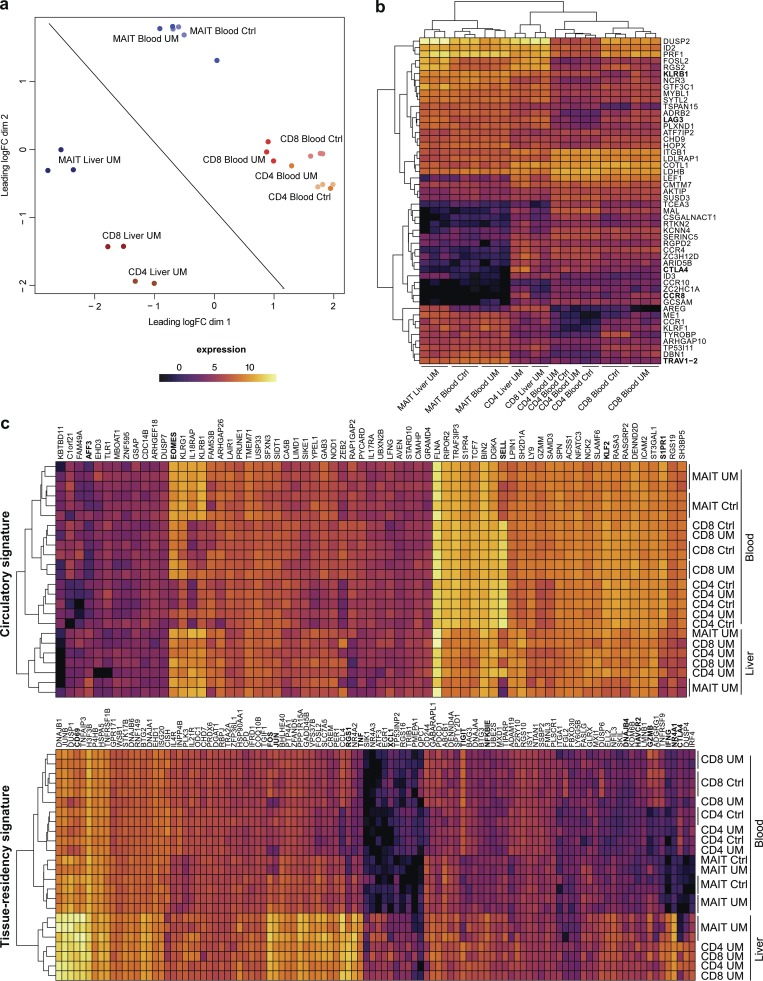
Figure 3.
Human MAIT cells express a tissue residency signature in the liver. (a) MDS scatter plot of gene expression by MAIT subsets as compared to conventional subsets in liver and blood. (b) Heat map and unsupervised hierarchical clustering based on the expression of the top 50 differentially expressed genes between blood MAIT and conventional T cells. (c) Heat map displaying expression of the human orthologs of the circulatory and tissue residency Runx3 core gene signature in the human samples.

