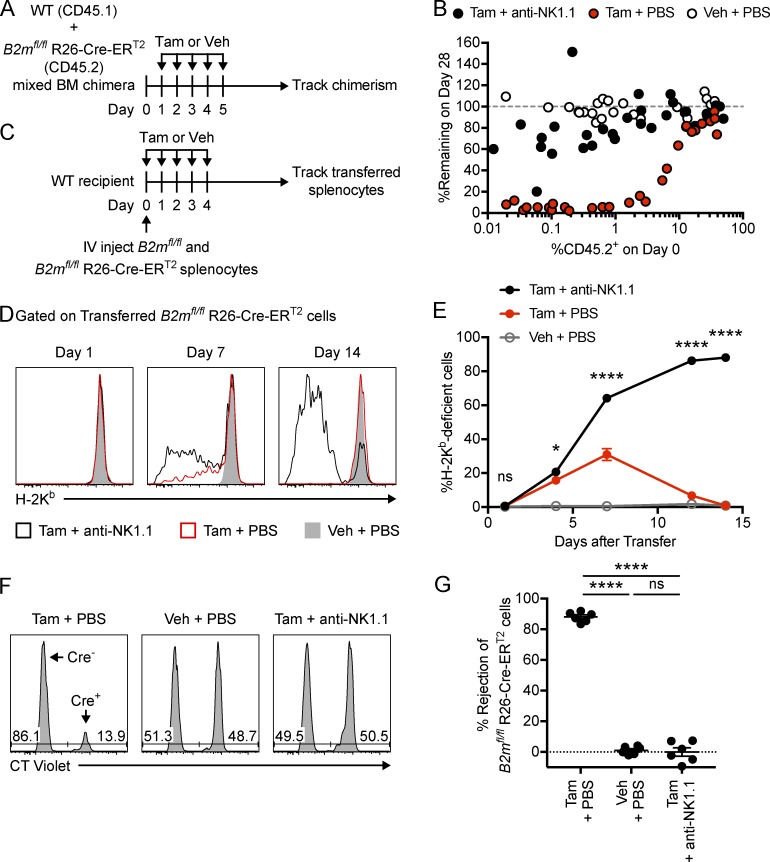
Figure 4.
Down-regulation of MHC-I is sufficient for missing-self recognition of a limited number of cells. (A) Mixed BM chimeras were generated by reconstituting irradiated WT (CD45.1) mice with different ratios of BM from WT (CD45.1) and B2mfl/fl R26-Cre-ERT2 (CD45.2) mice. After 18–21 wk, chimeras were treated with tamoxifen or vehicle control starting on day 1, and peripheral blood was analyzed weekly from day 0 to 28. Chimeras were injected with anti-NK1.1 to deplete NK cells or with PBS on day −2 and every 7 d after. (B) Percentage of B2mfl/fl R26-Cre-ERT2 cells remaining in the blood on day 28 relative to day 0. Percentage of CD45.2+ cells was assessed within all CD45.1 and/or CD45.2+ lymphocytes. (C) Splenocytes from B2mfl/fl and B2mfl/fl R26-Cre-ERT2 mice were labeled with CT far red and differentially labeled with CT violet and i.v. injected into WT recipient mice (20 × 106 of each donor). Recipient mice were subsequently treated with tamoxifen or vehicle for 5 d. Recipient mice were injected i.p. with anti-NK1.1 to deplete NK cells or with PBS control. (D) Representative histograms showing H-2Kb expression on transferred B2mfl/fl R26-Cre-ERT2 cells (CT far red+ CT violethigh) from blood of recipient mice over time. (E) Percentage of transferred B2mfl/fl R26-Cre-ERT2 cells that are H-2Kb–deficient in the blood of recipient mice over time (n = 6 mice per group; two-way repeated measure ANOVA with Bonferroni’s multiple comparisons test). Asterisks in E indicate statistical significance between the tamoxifen-treated groups treated with anti-NK1.1 or PBS. (F) Representative histograms showing the relative percentages of transferred cells (CT far red+) recovered from the spleens of recipient mice on day 14. B2mfl/fl (Cre−), and B2mfl/fl R26-Cre-ERT2 (Cre+) donor cells were distinguished by CT violet labeling as indicated. (G) Percentage of NK cell–specific rejection of B2mfl/fl R26-Cre-ERT2 donor cells by WT recipient mice treated as indicated (n = 6 mice per group; one-way ANOVA with Bonferroni’s multiple comparisons test). Data in B, E, and G are combined from two independent experiments in which all recipients within an experiment received the same mix of donor BM or splenocytes. Each symbol in B and G represents an individual recipient mouse. Error bars indicate mean ± SEM; *, P < 0.05; ****, P < 0.0001; ns, not significant. Tam, tamoxifen; Veh, vehicle.

