Figure 1.
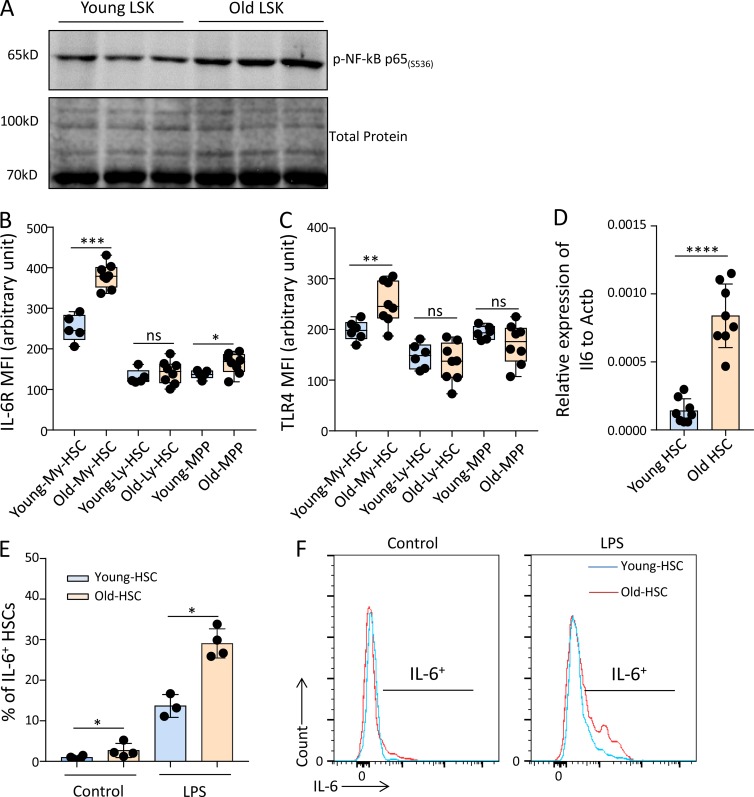
Aging increases the ground-stage activity of NF-κB signaling in HSPCs. (A) Representative Western blot showing the level of phospho-NF-κB p65 (Ser536) in LSK cells from young (2–3 mo old) and old (24 mo old) mice (n = 3 mice per pool per lane for each experiment, n = 2 independent experiments, one of the two experiments is shown; the other experiment shows a similar result). (B and C) Mean fluorescence intensities (MFI) determined by FACS for IL-6R and TLR4 expression on freshly isolated My-biased HSCs, Ly-biased HSCs, and MPPs from young (2–3 mo old) and old mice (22–24 mo old). The box plots represent the interquartile range (25–75%), with the median; whiskers correspond to min and max values. The dots indicate individual mice (in total, n = 5–8 mice per group were analyzed in n = 2 independent experiments). My-biased HSC: CD150hiCD34−LSK; Ly-biased HSC: CD150loCD34−LSK; MPP: CD34+LSK. (D) mRNA expression of Il6 relative to Actb was analyzed in freshly isolated HSCs from young (2 mo old) and old (24 mo old) mice (in total, n = 8 mice per group were analyzed in n = 2 independent experiments). HSC: CD150+CD34−LSK. (E and F) Young (3 mo old) and old (24 mo old) wild-type mice received an i.p. injection of LPS (1.5 mg/kg) and were sacrificed 3 h later. c-Kit+–enriched BM cells were isolated and cultured for 4 h with secretion inhibitor (Brefeldin A). The level of IL-6 in the HSC population was measured by FACS (n = 3–4 mice per group were used in total in n = 2 independent experiments). (E) The histogram depicts the percentages of IL-6–positive HSCs of the indicated age groups. (F) Representative FACS profiles showing the level of IL-6 in indicated groups.(B–E) Statistical significance was assessed by using the Welch’s t test after log transformation (B–D) or with the two-way ANOVA followed by Tukey’s multiple comparison test on logit-transformed data (E). All data represent mean ± SD; *, P < 0.05; **, P < 0.01; ***, P < 0.001; ****, P < 0.0001; ns, not significant.

