Figure 2.
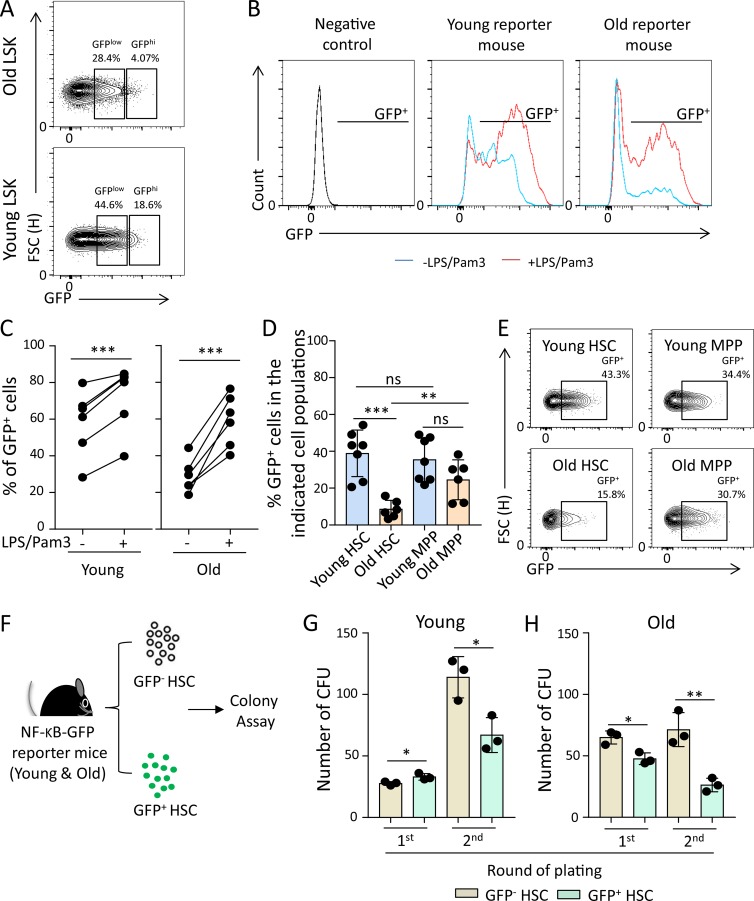
NF-κB activation in steady-state hematopoiesis phenotypically correlates with enhanced differentiation of HSPCs in aging mice. (A) Representative FACS plots showing percentages of GFPlow and GFPhi cells in LSK cells of the indicated groups. (B and C) Freshly isolated LSK cells from young (3 mo old) and old (24 mo old) NF-κB reporter mice were cultured with or without LPS/Pam3 treatment for 8 h. The percentages of GFP+ cells (NF-κB–activated cells) were determined by FACS. (B) Representative FACS profiles for GFP expression in the indicated groups. (C) The chart shows percentages of GFP+ cells in stimulated LSK cells compared with nonstimulated LSK cells of the indicated groups (in total, n = 6 mice per group were analyzed in n = 2 independent experiments). The dots indicate pairs of aliquots of LSK cells from the same individual mice exposed to the indicated treatments. Statistical significance was assessed by paired t test after logit transformation of the data. (D) The percentage of GFP+ cells in the indicated hematopoietic populations from young (3 mo old) and old (24 mo old) NF-κB reporter mice was determined by FACS (in total, n = 7 young mice and n = 6 old mice were analyzed in n = 2 independent experiments). (E) Representative FACS plots showing percentages of GFP+ cells in HSCs and MPPs of the indicated groups. Statistical significance was assessed by Welch’s t test after logit transformation of the data. (F–H) CD150+CD34−LSK cells were sorted from the BM of young (2–3 mo old) and old (24 mo old) NF-κB reporter mice and serially plated in methylcellulose medium at 12-d intervals (first plating: 500 CD150+CD34−LSK cells/triplicate; second plating: 5,000 CD45+DAPI− cells/duplicate). (F) Schematic diagram of the experiment. (G and H) The histograms show the absolute number of colonies in the indicated groups and round of plating (in total, n = 3 mice per group were analyzed in two independent experiments, n = 2–3 technical repeats per mouse). Statistical significance was assessed after log transformation by Welch’s t test. All data represent mean ± SD; *, P < 0.05; **, P < 0.01; ***, P < 0.001; ns, not significant. FSC, forward scatter.

