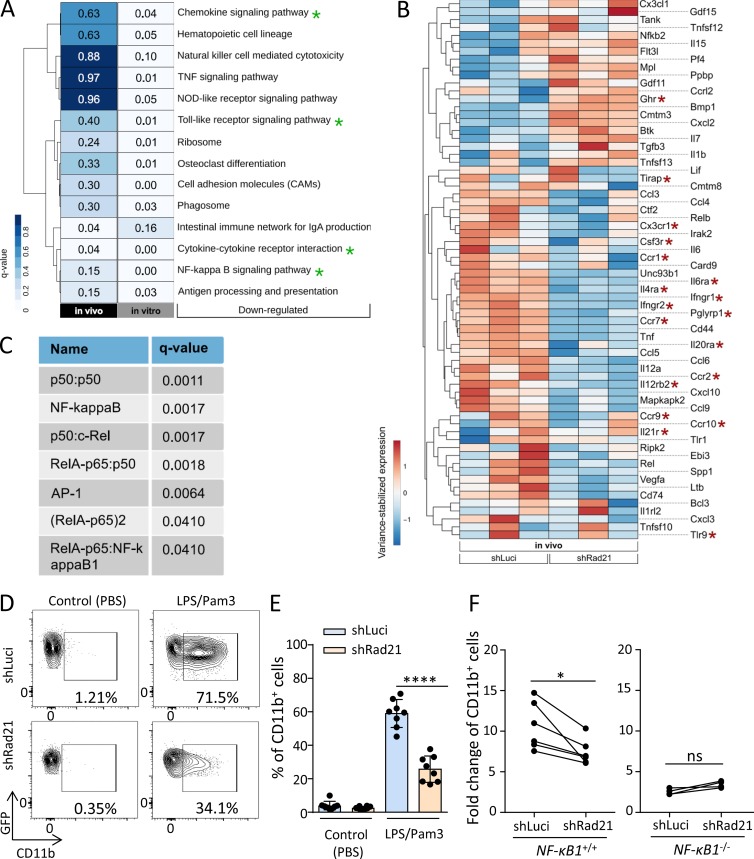
Figure 4.
Rad21 mediates differentiation of HSPCs in response to inflammation through NF-κB–dependent signaling. (A) Analysis of DEGs in two RNA-seq experiments: (1) on GFP+CD48−Sca-1+ cells purified from cultured LSK cells, 3 d after isolation and lentiviral infection with an shRNA targeting Rad21 or a control shRNA (luciferase = luci) and (2) on freshly isolated GFP+ LSK cells from mice that were transplanted with lentivirally infected LSK cells (shRNA-Rad21 or shRNA-luci), 4 mo after transplantation. KEGG pathway analysis shows the 14 most down-regulated pathways in Rad21 knockdown cells versus control cells. The analysis did not identify significantly (q < 0.1) up-regulated pathways. Green asterisks highlight NF-κB–related pathways. DEGs in these pathways from the in vivo analysis are depicted in B. (B) The heat map shows DEGs based on GO-terms related to the KEGG pathways highlighted in A (in vivo) in freshly isolated Rad21 knockdown LSK cells (shRad21) versus control (shLuci) LSK cells reisolated 4 mo after LSK cell transplantation. The heat map shows row-scaled and variance-stabilized expression counts for each gene. Red asterisks highlight inflammatory receptor genes. (C) The seven top transcription factor complexes, regulating DEGs in the experiment on culture-activated LSK cells (Fig. S2 A), were identified with the help of the GeneTrail web service. All significant DEGs were sorted according to their fold change and used as input for GeneTrail with default parameters. An adjusted P value cutoff of 0.05 was applied to select the most significant enriched/depleted transcription factor complexes, regulating these DEGs. Seven depleted transcription factor complexes (q < 0.05) were identified in shRad21-LSK cells. (D and E) 5,000 GFP+LSK cells were isolated from the recipient mice of Rad21 knockdown or control LSK cells at 4 mo after transplantation and cultured for 3 d. The percentage of CD11b+ cells in the cultures was determined by FACS. (D) Representative FACS plots showing percentages of CD11b+ cells in the indicated groups. (E) The histogram shows the percentage of CD11b+ cells in the LSK cell cultures in the indicated groups (in total, n = 8 mice per group were analyzed in n = 2 independent experiments). Statistical significance was assessed with two-way ANOVA followed by Tukey’s multiple comparison test on logit-transformed data. (F) LSK cells from 16-mo-old NF-κB1−/− or wild-type mice were infected with viruses carrying shRNAs against Rad21 or luciferase and cultured with or without LPS/Pam3 for 3 d. The graphs depict the increase in differentiation of LSK cells into myeloid cells (CD11b+) in LPS/Pam3-treated cultures relative to PBS-treated cultures of LSK cells from wild-type mice (left) and LSK cells from NF-κB1−/− mice (right) that were infected with the indicated shRNAs. The dots represent individual mice (in total, n = 6 wild-type mice and n = 4 NF-κB1−/− mice were analyzed in n = 2 independent experiments). Statistical significance was assessed with paired t test after log transformation. All data represent mean ± SD; *, P < 0.05; ****, P < 0.0001; ns, not significant.

