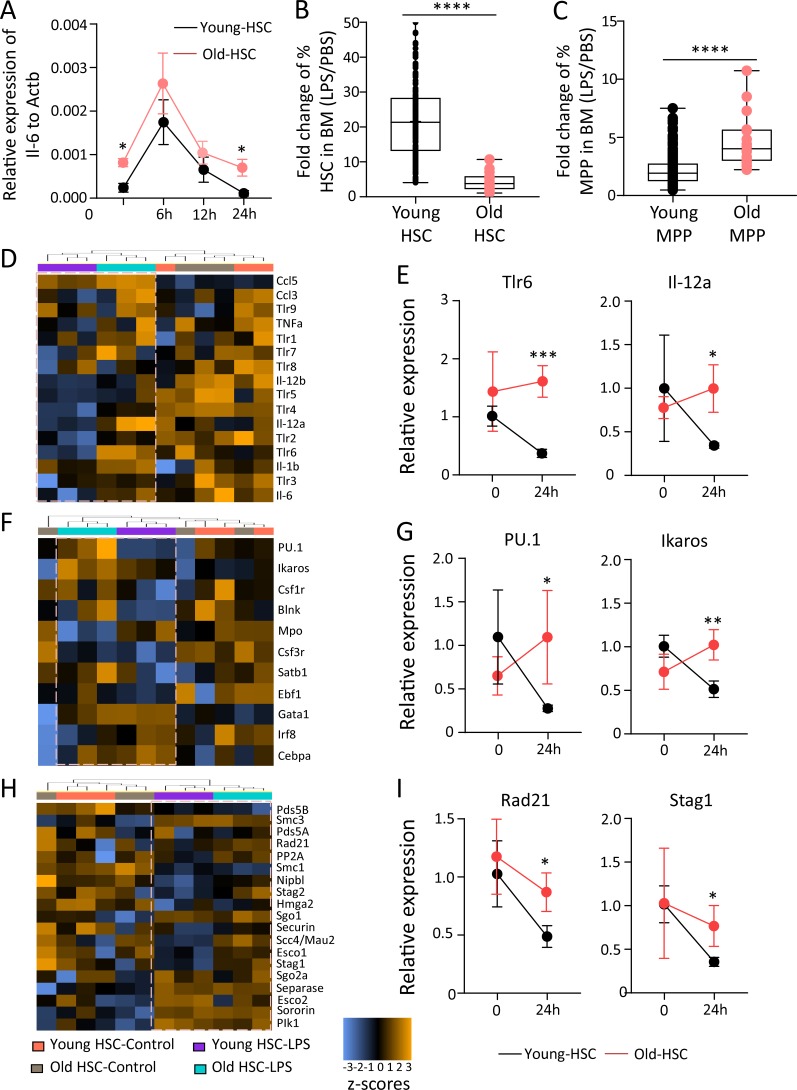
Figure 6.
Age-dependent impairment in expansion potential of HSCs in response to LPS exposure associates with a failure to down-regulate inflammation signaling and cohesin expression in the resolution phase of inflammation. (A) HSCs (CD150+CD34−LSK) were isolated from young (2–3 mo old) and old (24 mo old) wild-type mice and treated with PBS or LPS (200 ng/ml) for 2 h. mRNA expression of Il6 relative to Actb was analyzed at the indicated time points after LPS stimulation (n = 3–4 mice per group). Statistical significance was assessed with Welch’s t test after log transformation. (B–I) In vivo LPS stimulation was performed in young (2–3 mo old) and old (24 mo old) wild-type mice at a dose of 1.5 mg/kg body weight. Mice were sacrificed at 24 h after LPS injection. (B and C) The charts depict the fold change in the percentages of HSCs (B) and MPPs (C) in BM of LPS-stimulated mice relative to control (PBS injected) mice of the indicated age groups. Multiple pairwise comparisons of fold changes of HSCs (CD150+CD41−CD34−LSK; B) and MPPs (CD34+ LSK; C) were performed. Wilcoxon test was used to test difference of all pairwise ratios for each cell type (in total, n = 16 young mice and n = 4 old mice were analyzed in four independent experiments). (D–I) NanoString analysis was performed on HSCs from young (2–3 mo old) and old (24 mo old) mice, 24 h after LPS injection along with controls. The heat maps show the clustering of the indicated groups according to changes in the mRNA expression of inflammatory genes (D), differentiation factors (F), and cohesin genes and cohesin regulator genes (H). (E, G, and I) Histograms show the relative mRNA expression of representative genes encoding for cytokines (E), differentiation inducing factors (G), or cohesin components (I). The depicted representative examples were selected from the NanoString analysis in D, F, and H. The data are shown as linear fold change relative to the nontreated young control (n = 12 young mice in three pools of 4 mice per pool, and n = 3 old mice as individual samples). 12 housekeeping genes were used for the normalization of the expression value. Statistical significance was assessed with Welch’s t test after log transformation. Data represent mean ± SD; *, P < 0.05; **, P < 0.01; ***, P < 0.001; ****, P < 0.0001.

