Figure 1.
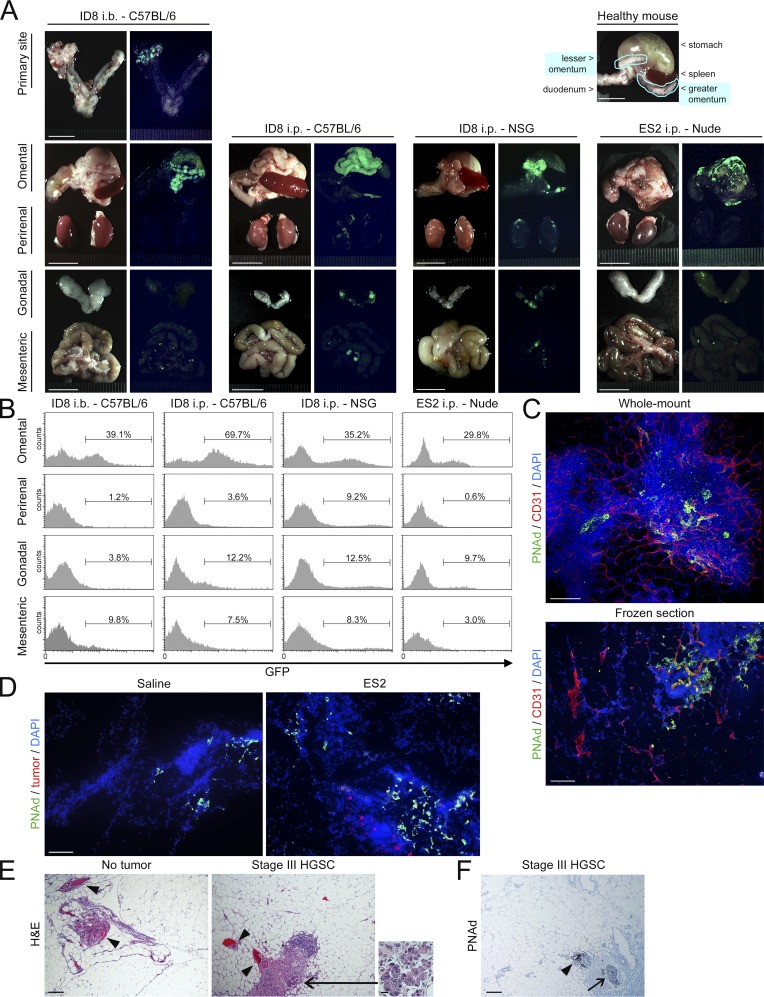
Ovarian cancer cells preferentially implant on the omentum, and this tropism is not affected by lymphoid deficiency. (A and B) GFP-expressing ID8 cells were injected i.b., between the left ovary and oviduct and contralateral to the omentum, into immunocompetent C57BL/6 mice, and tumors were evaluated at 6 wk thereafter. ID8 cells were injected i.p. into female immunocompetent C57BL/6 and NSG mice, and tumors were evaluated at 10 wk thereafter. GFP-expressing ES2 cells were injected i.p. into female nude mice, and tumors were evaluated at 9 d thereafter. Five mice per group were evaluated. (A) Representative images of tissues in each group viewed under light and fluorescence microscopy. Location of the omentum in a healthy mouse is also shown. Bars, 10 mm. (B) Representative flow cytometric analyses of the abundance of GFP+ tumor cells in each visceral fat tissue (omental, perirenal, gonadal, and mesenteric), expressed as a percentage of the nonfat cellular content in each tissue. (C) Visualization of total vasculature (CD31+; red) and HEVs in milky spots (PNAd+; green) in the naive mouse omentum by immunofluorescence staining of whole mount (top) and frozen (bottom) sections. Bars, 100 µm. Shown are representative results of three independent experiments. (D) Omental tissues were collected from nude mice at 5 d following i.p. injection of ES2 cells or saline (n = 5 mice per group). Frozen sections were stained to detect cancer cells (red) and PNAd+ vessels in milky spots (green). Bar, 100 µm. Shown are representative examples of staining. (E and F) Omental tissues of women without cancer and with stage III HGSC were stained with (E) H&E and with (F) Ab to PNAd (n = 3 cases per group). Bar, 200 µm. Indicated are vessels within or adjacent to milky spots (arrowheads) and tumor foci (arrows). Inset shows foci at higher magnification. Bar, 20 µm. Shown are representative examples of staining.

