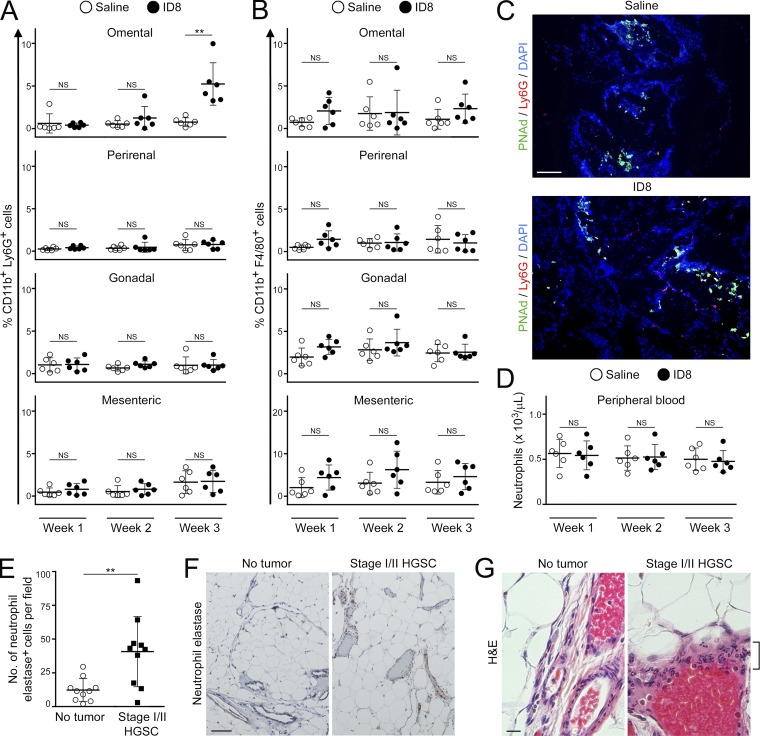
Figure 2.
Early-stage ovarian tumors trigger an increase in neutrophil abundance in the premetastatic omental niche. (A and B) Immunocompetent C57BL/6 mice were injected i.b. with ID8 cells that express GFP and luciferase. Control siblings were injected i.b. with saline. Mice were evaluated at 1, 2, and 3 wk thereafter (n = 6 mice per group at each time point). Absence of palpable metastasis was confirmed in the ID8 groups by bioluminescence imaging and by flow cytometric analysis of tissues ex vivo. Visceral fat tissues of each mouse in the ID8 and control groups were stained with Abs to CD11b, Ly6G, and F4/80, and staining was analyzed by flow cytometry. Shown are the abundance of CD11b+Ly6G+ cells (neutrophils; A) and CD11b+F4/80+ cells (macrophages; B), expressed as percentages of the nonfat cellular content in each tissue. **, P < 0.01 (unpaired t test). (C) Staining of Ly6G+ cells (red) and PNAd+ vessels (green) in omental tissues collected from C57BL/6 mice at 3 wk following i.b. injection of nonfluorescent ID8 cells or saline (n = 5 mice per group). Bar, 100 µm. Shown are representative examples of staining. (D) Circulating neutrophil counts in C57BL/6 mice were determined by CBC test at 1, 2, and 3 wk following i.b. injection of ID8 cells or saline (n = 6 mice per group at each time point; unpaired t test). (E–G) Analysis of omental tissues of women with stage I/II HGSC and without cancer (n = 10 cases per group). (E) Average number of neutrophil elastase+ cells for each case in each group. For each case, the average number of neutrophil elastase+ cells was calculated by scoring four random ×100 microscopic fields in stained sections. **, P < 0.01 (Mann–Whitney U test). (F) Representative examples of neutrophil elastase staining. Bar, 100 µm. (G) H&E-stained sections. Cells with segmented morphology characteristic of neutrophils (bracket) are seen surrounding a vessel in omental tissue of a woman with HGSC. Bar, 20 µm. Error bars in A, B, D, and E represent SD.

