Figure 5.
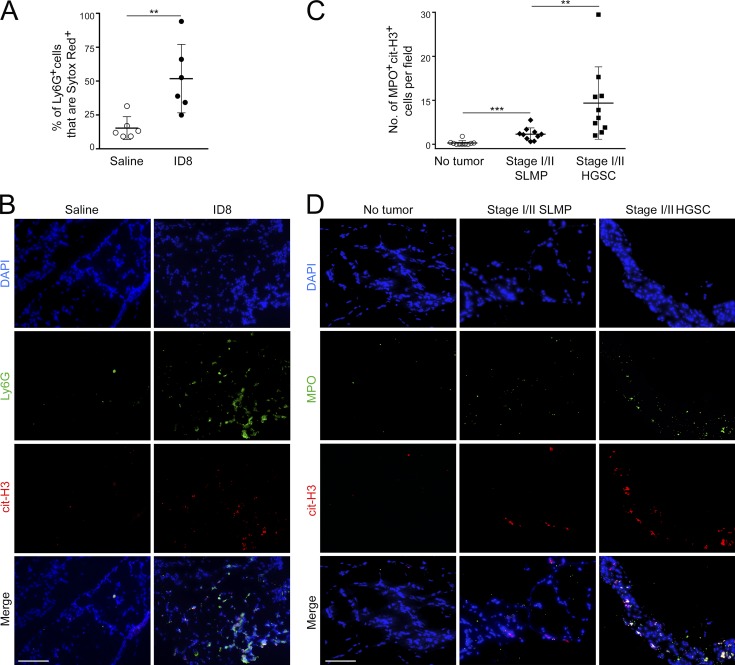
Early-stage ovarian tumors induce NET formation in the premetastatic omental niche. (A and B) Analysis of mouse omental tissues. (A) C57BL/6 mice were injected i.b. with ID8 cells or with saline (n = 6 mice per group) and euthanized at 3 wk thereafter. Fresh omental tissues were stained with Sytox Red dye to detect extruded DNA and with Ly6G Ab, and staining was analyzed by flow cytometry. Shown are proportions of omental Ly6G+ cells that were Sytox Red+ in each mouse of each group. **, P < 0.01 (unpaired t test). (B) Frozen sections of omental tissues were stained to detect Ly6G (green) and cit-H3 (red). Bar, 100 µm. Nonfluorescent ID8 cells were used to inject mice. Shown are representative examples of staining. (C and D) Analysis of human omental tissues. Immunofluorescence staining of MPO (green) and cit-H3 (red) was performed on FFPE sections of omental tissues of women with stage I/II HGSC, with stage I/II SLMP, or without cancer history. (C) Average numbers of MPO+cit-H3+ cells are shown for each case in each group (n = 10 cases per group). For each case, the average number of MPO+cit-H3+ cells was calculated by counting double-positive cells in five random ×200 microscopic fields. **, P < 0.01; ***, P < 0.001 (Mann-Whitney U test). (D) Representative examples of staining. Bar, 100 µm. Error bars in A and C represent SD.

