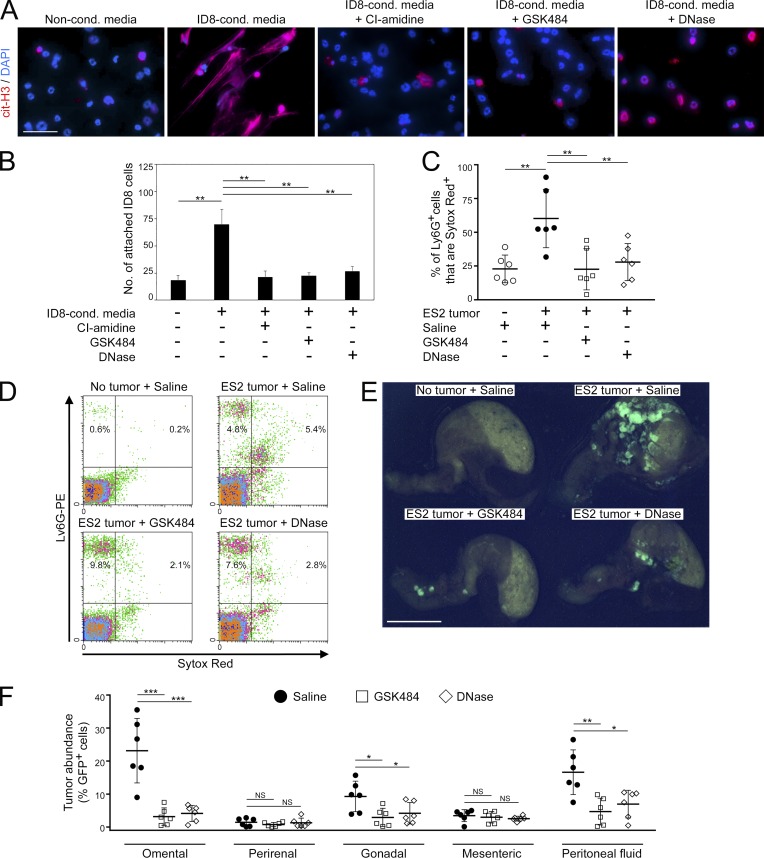
Figure 8.
NET-inhibiting agents decrease omental metastasis. (A) Normal bone marrow neutrophils of C57BL/6 mice were stimulated for 4 h with nonconditioned media or with ID8-conditioned media without or with addition of CI-amidine (100 µM), GSK484 (10 µM), or DNase (1 µg/ml) and then stained with cit-H3 Ab (red). Bar, 50 µm. Three independent experiments were performed. Shown are representative examples of staining. (B) ID8 cells were assayed for attachment to neutrophils that had been prestimulated, as described in A. Shown are means ± SD of three independent experiments, where attached cancer cells were counted in four random ×200 microscopic fields in each experiment. Each experiment used neutrophils from a different donor. **, P < 0.01 (unpaired t test). (C–F) Female nude mice were injected i.p. with GFP-expressing ES2 cells. At 1 d thereafter, mice were randomized into groups and then administered saline, GSK484 (20 mg/kg), or DNase (5 mg/kg) i.p. daily for 9 d. A nontumor control group of mice was administered saline i.p. daily for 9 d. Thereafter, mice in all groups were euthanized (n = 6 mice per group). (C) Omental tissues were stained with Ly6G Ab and Sytox Red dye, and staining was analyzed by flow cytometry. Shown are the proportion of omental Ly6G+ cells that were Sytox Red+ in each mouse of each group. **, P < 0.01 (unpaired t test). (D) Representative examples of Ly6G and Sytox Red staining analysis. (E) Representative images of GFP+ tumors on the omentum. Bar, 10 mm. (F) The abundance of GFP+ tumor cells in fat tissues and in peritoneal fluid of each mouse in the ES2 groups was quantified by flow cytometric analysis. *, P < 0.05; **, P < 0.01; ***, P < 0.001 (unpaired t test). Error bars in C and F represent SD.

