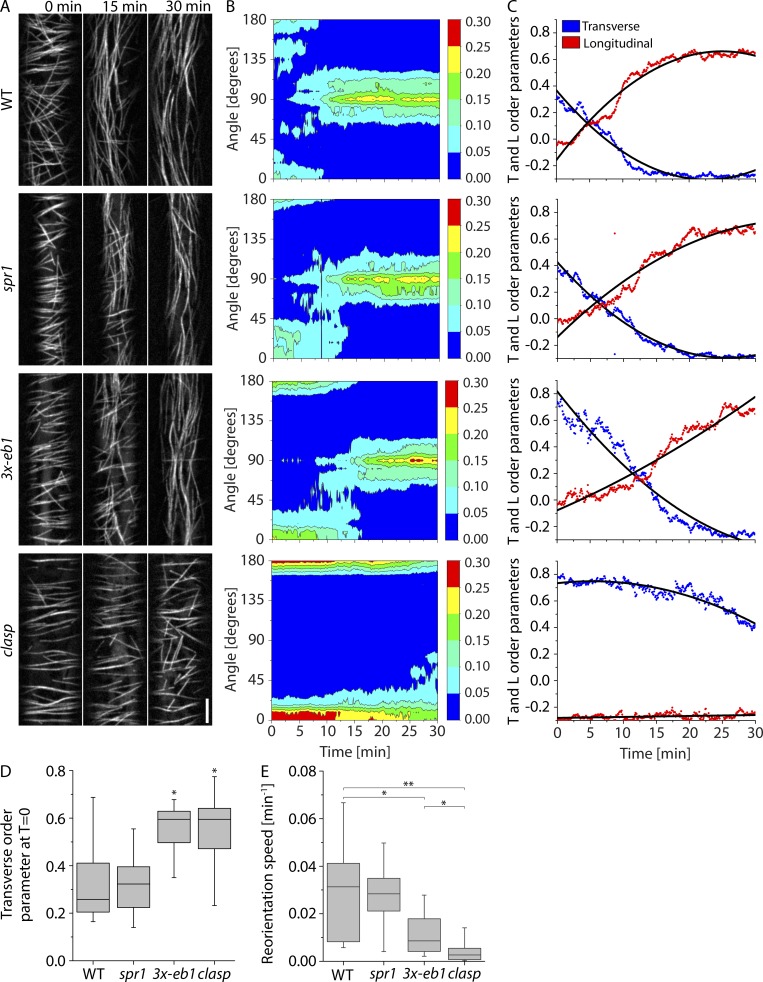
Figure 1.
Microtubule reorientation in +TIP mutants. (A) Panels from confocal image time series of dark-grown hypocotyl cells expressing YFP-TUA5 in WT, spr1, 3- eb1, and clasp mutant backgrounds at 0, 15, and 30 min after induction of reorientation by blue light. See Video 1. Scale bar is 5 µm. (B) Representative contour plots of MT orientation over time corresponding to the videos shown in A. The color scale represents fraction of microtubules. (C) Longitudinal and transverse order parameters during MT reorientation for the videos shown in A. Black lines show quadratic fit. (D) Transverse order parameter at T = 0 for cortical microtubules imaged in WT, spr1, 3x-eb1, and clasp seedlings. n = 8, 9, 9, and 9 cells, respectively. A Kruskal–Wallis test showed significant differences among the genotypes (P < 0.01). Asterisks represent significant difference from WT by Mann–Whitney U test (P < 0.05). (E) Longitudinal reorientation speed (Lindeboom et al., 2013b) of imaged microtubule arrays in etiolated hypocotyl cells expressing YFP-TUA5 in WT, spr1, 3x-eb1, and clasp seedlings. A Kruskal–Wallis test showed significant differences for reorientation speed distributions among the genotypes (P < 0.01). n = 8, 9, 9, and 9 cells, respectively. Asterisks represent significant difference from WT in Mann–Whitney U test (*, P < 0.05; **, P < 0.01; ***, P < 0.001). Boxplots show the 25th and 75th percentile as box edges, the line in the box indicates median value, and the whiskers show the 2.5th and 97.5th percentile.

