Figure 2.
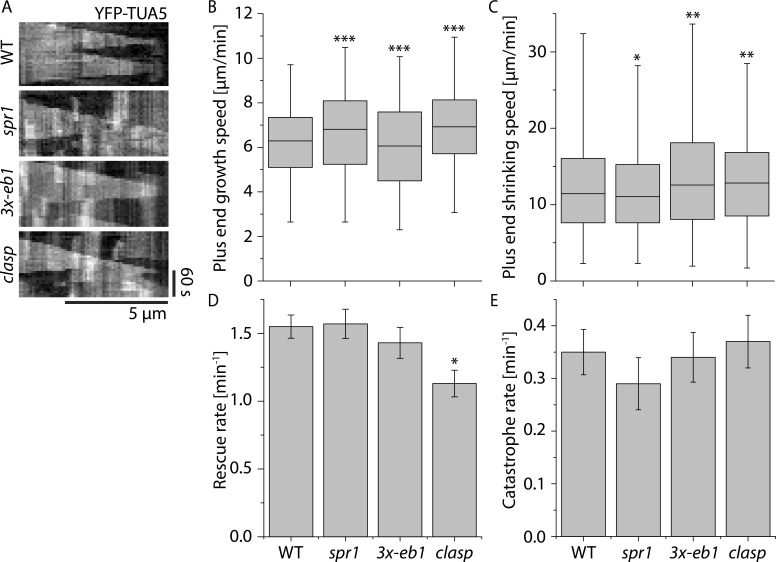
Microtubule plus end dynamics in +TIP mutants. (A) Kymographs of microtubules during early stages of cortical array reorientation induced by blue light in WT, spr1, 3x-eb1, and clasp seedlings expressing YFP-TUA5. (B and C) Boxplot of microtubule plus end growth speeds (B) and plus end shrinkage speeds (C) in n = 2,148, 1,405, 1,837, and 1,516 segments measured in WT, spr1, 3x-eb1, and clasp seedlings, respectively. Boxplots show the 25th and 75th percentile as box edges, the line in the box indicates median value, and the whiskers show the 2.5th and 97.5th percentile. Asterisks indicate a significant difference from WT. (D) Microtubule rescue rates. n = 213, 135, 110, and 116 rescues in WT, spr1, 3x-eb1, and clasp mutant backgrounds, respectively. Error bars represent SEM. Asterisks indicate a significant difference by rate ratio test. (E) Microtubule catastrophe rates. n = 190, 119, 155, and 148 rescues in WT, spr1, 3x-eb1, and clasp mutant backgrounds, respectively. Error bars represent SEM. Asterisks indicate significant difference compared with WT by rate ratio test. *, P < 0.05; **, P < 0.01; ***, P < 0.001. Data for all measurements are from six cells in six plants for each genotype.

