Figure 5.
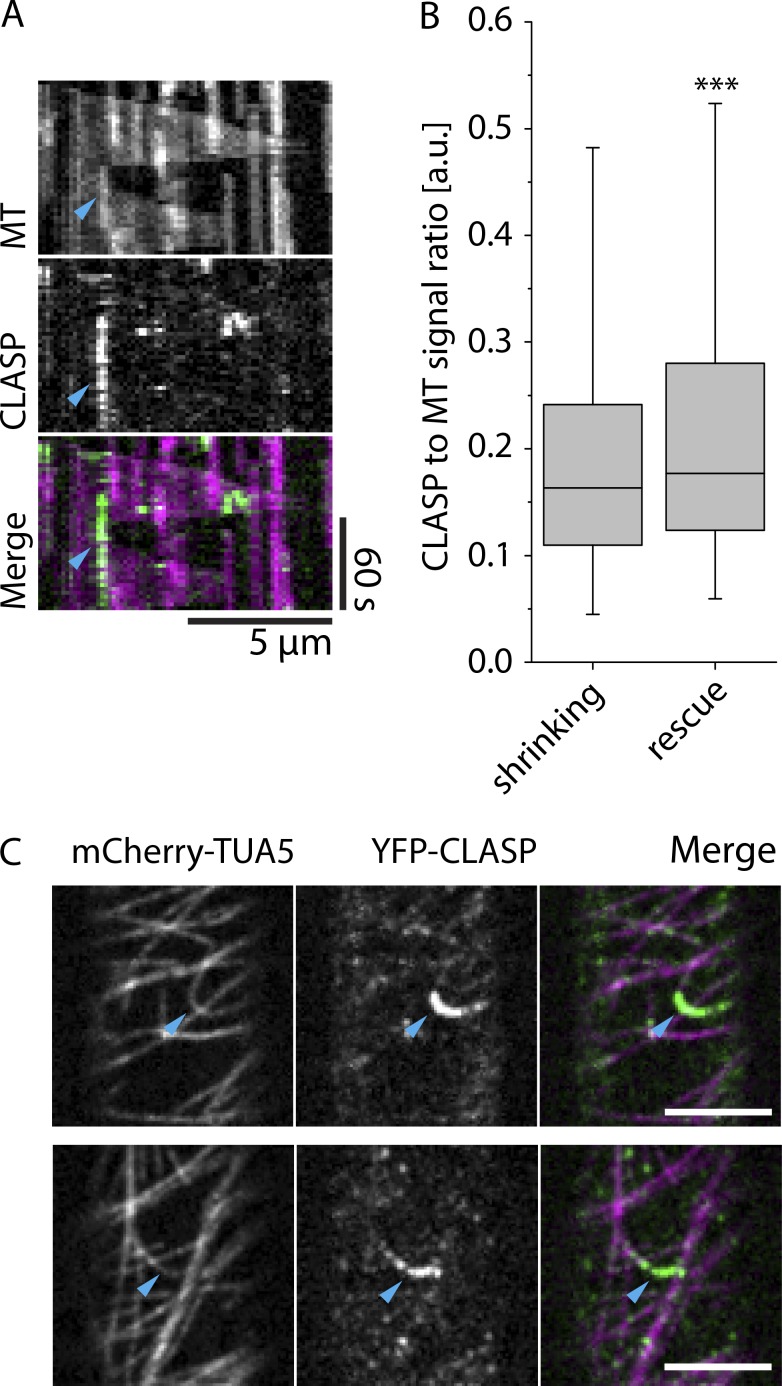
CLASP signal and microtubule rescue. (A) Kymograph of a MT rescue event coinciding with high CLASP signal intensity. Cyan arrowhead indicates the point of MT rescue. (B) Boxplot of CLASP-to-MT signal intensity ratios for microtubules that continue shrinking and microtubules that get rescued. Boxplots show the 25th and 75th percentile as box edges, the line in the box indicates median value, and the whiskers show the 2.5th and 97.5th percentile. Microtubules were observed shrinking in 2,716 frames, and we observed rescue 301 times. CLASP-to-MT signal intensity ratios were shown to be significantly higher in locations where the rescues occurred by Mann–Whitney U test; ***, P < 0.001. (C) Examples of high CLASP signal intensity on highly curved microtubule in 3-d-old dark-grown hypocotyl epidermal cell expressing YFP-CLASP and mCherry-TUA5 (see Video 5). Scale bars are 5 µm.

