Figure 4.
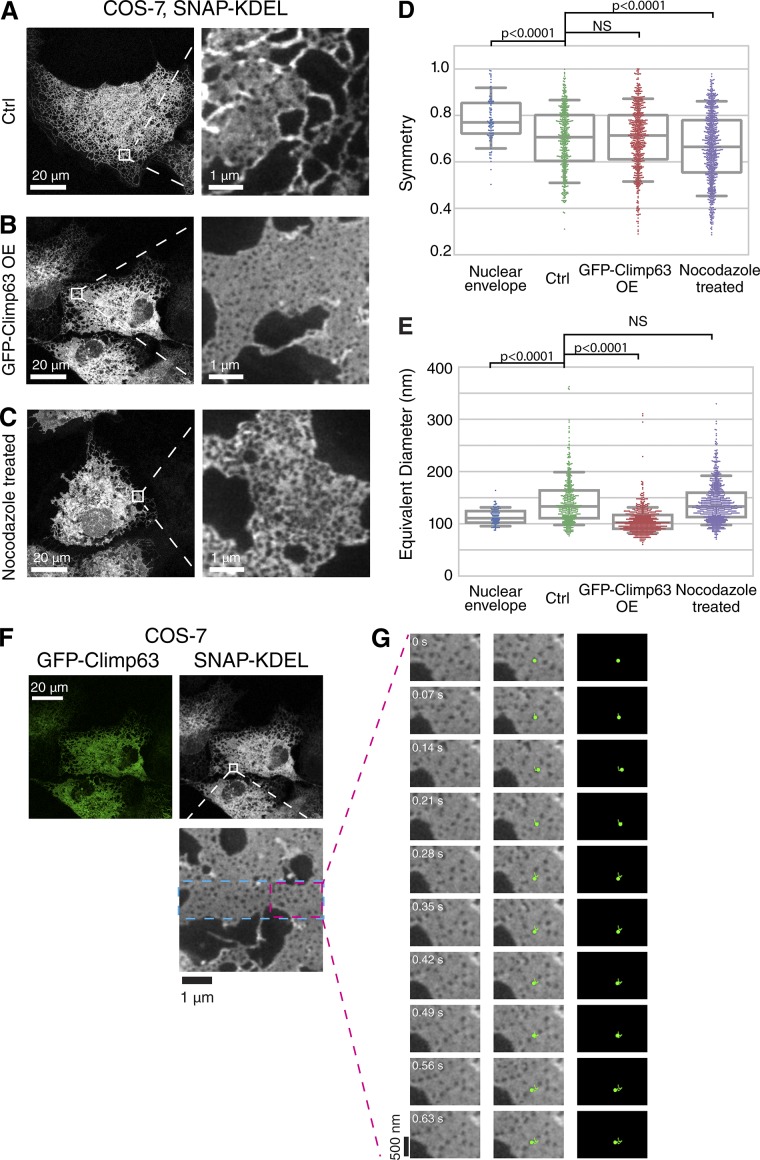
Analysis of the role of Climp63 and microtubules on the nanoscale architecture of ER membranes. (A–C) Confocal images of SNAP-KDEL in living COS-7 cells (left) and STED image of magnified boxed region (right) in indicated conditions. (D and E) Plot of hole symmetry (unitless) and hole-equivalent diameter in indicated conditions. Median and interquartile range are shown with whiskers drawn down to the 10th percentile and up to the 90th percentile. Median and interquartile range for hole symmetry: NE, 0.77, 0.13; Unperturbed, 0.71, 0.21; GFP-Climp63 overexpressing (OE), 0.71, 0.19; and nocodazole treatment, 0.66, 0.23. Median and interquartile range for diameter in nm: NE, 111, 22; Unperturbed, 133, 53; GFP-Climp63 overexpression, 102, 26; and nocodazole treatment, 133, 47. Measurements for each plot were taken from NE, n = 97 holes, n = 3 cells; Unperturbed, n = 424 holes, n = 2 cells; GFP-Climp63, n = 601 holes, n = 3 cells; and nocodazole treatment, n = 713 holes, n = 4 cells. Kruskal–Wallis test with a post hoc Dunn’s test for multiple comparisons determined significance. (F) Overview confocal images and magnified STED image of ER network in a living COS-7 cell expressing GFP-Climp63 (green) and SNAP-KDEL (grayscale). Dashed blue line in magnified STED image outlines the 4.8 × 1.2-µm region imaged over time. The region outlined by the dashed magenta boxed is shown in G. (G) Select STED images paired with pseudocolored image and image overlay (third column) to highlight a manually tracked nanohole that persists over time. Time shown in seconds.

