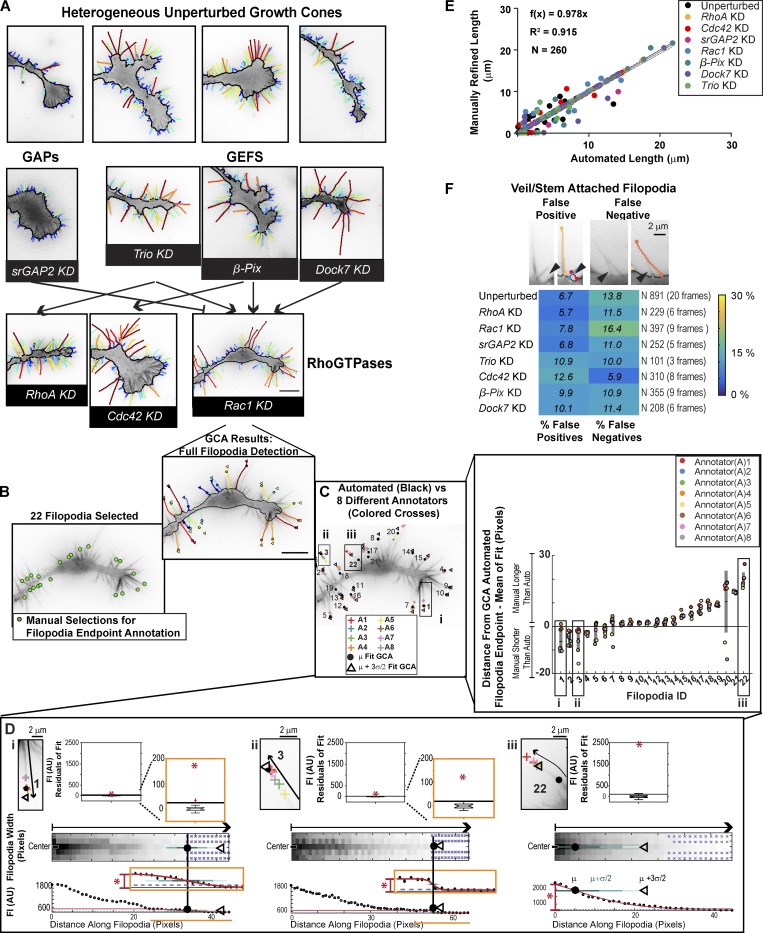
Figure 2.
Validation of GCA for segmentation of N1E-115 GCs. (A) GCA segmentation of N1E-115 GCs expressing GFP LifeAct on laminin. Embedded actin bundle detections not shown for clarity. (See Fig. S1, A and B, for raw images). GCs of KDs, as in Fig. S1 B, shown in context of their putative network interactions (see GC scale morphodynamic phenotypes section for references). See Videos 4, 5, and 6. Bar, 10 µm. (B–D) Variability in manual filopodia endpoint localization among annotators (see Materials and methods). (D) GCA filopodia linescan/fitting for example filopodia (i–iii). Boxplot insets (top): Distribution of the residuals for each fit compared with the fit amplitude (red star). Given the multiple scales of intensity decay in i and ii, fit regions, and the boxplots of the fit residuals, are magnified as indicated by orange insets. (E) Automated GCA versus manually refined filopodia lengths. See Fig. S4 A. Black line: Perfect correlation. Gray solid line: Linear fit to data. Gray dotted lines: CI of the fit. (F) GCA detection error for veil/stem attached filopodia. Top: Example overlays. Black arrowheads: Detection error. Bottom: Heat map of error rates.

