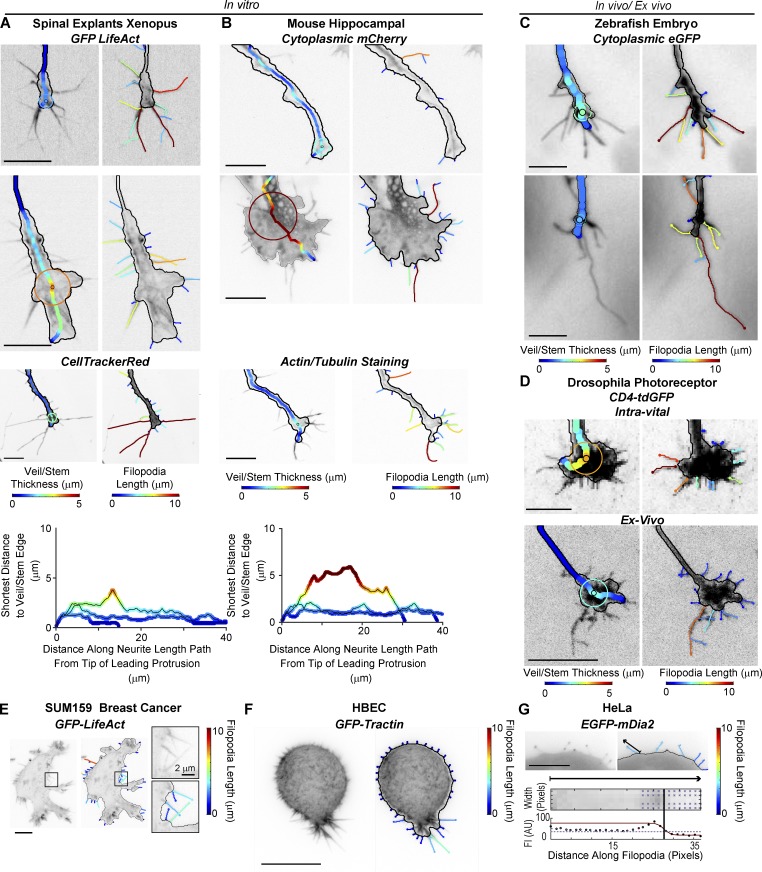
Figure 3.
GCA applied to a variety of cellular images. (A–D) GCA veil thickness (left) and filopodia (right) overlays for GCs of different size, type, and fluorescent label imaged in vitro (A and B) and in vivo/ex vivo (C and D). Xenopus spinal explants (A) and mice hippocampal neurons (B): unpublished data courtesy of Lowery Laboratory, Boston College, and Gupton Laboratory, University of North Carolina at Chapel Hill, respectively. (A and B) Bottom: Veil/stem size profiles comparing the GCs shown in the first three rows of A (left) and B (right). (C) Rohon–Beard GCs in a zebrafish embryo: previously published raw images in St John and Key (2012). (D) Intra-vital (top) and ex vivo images (bottom) of Drosophila photoreceptor GCs: maximum intensity projections as in Langen et al. (2015) and Özel et al. (2015), respectively. See Video 7. (E and F) GCA segmentation of 2D maximum intensity projections of SUM159 triple negative human breast cancer cell (E) and transformed human bronchial epithelial cell (HBEC) in a collagen I matrix imaged using meSPIM (F; Welf et al., 2016). (G) GCA segmentation of a HeLa cell expressing a filopodium-tip localizing marker. Bottom: Automated line scan along sparsely labeled filopodium marked by arrow. Bar, 10 µm, unless noted.

