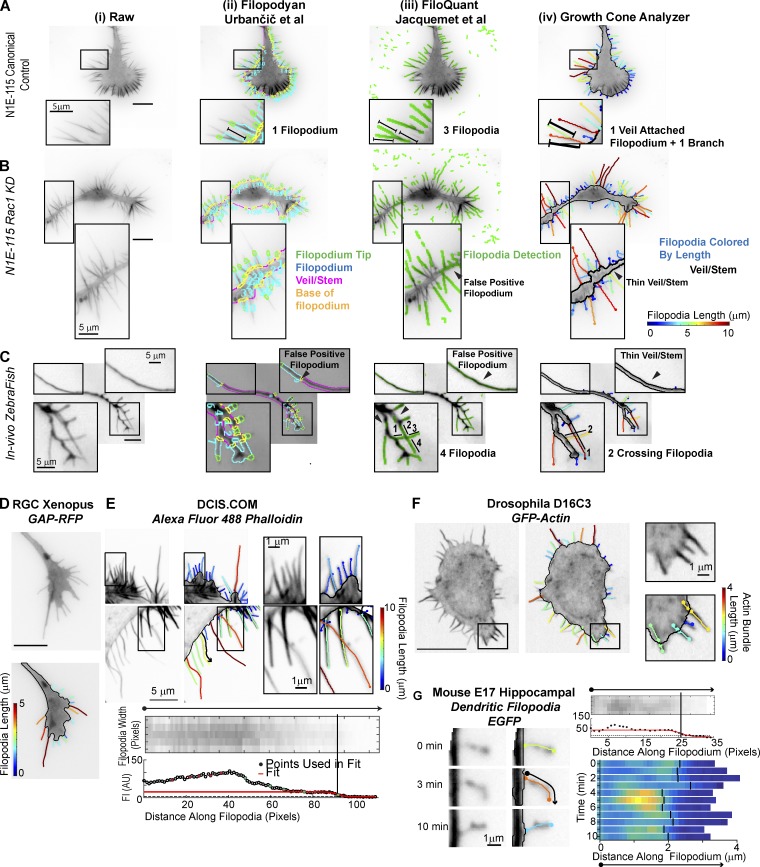
Figure 4.
Comparison of GCA to contemporary filopodia detection software. (A–C) Segmentation overlays generated using Filopodyan (Urbančič et al., 2017; ii), FiloQuant (Jacquemet et al., 2017; iii), or GCA (iv). N1E-115 GCs expressing GFP-LifeAct (A and B) and a Rohon–Beard GC (C) in a zebrafish embryo (see Fig. 3 C). Visualization as in respective package. Zoomed regions highlight segmentation challenges. (D–G) GCA segmentation using previously published raw images available with contemporary software releases. (D and E) Filopodyan (Urbančič et al., 2017) and FiloQuant (Jacquemet et al., 2017). Bottom: Zoom and local intensity fit of filopodium marked by the black arrow in top image. (F and G) CellGeo (Tsygankov et al., 2014) and Dendritic Filopodia Motility Analyzer (Tárnok et al., 2015). Bar, 10 µm, unless noted.

