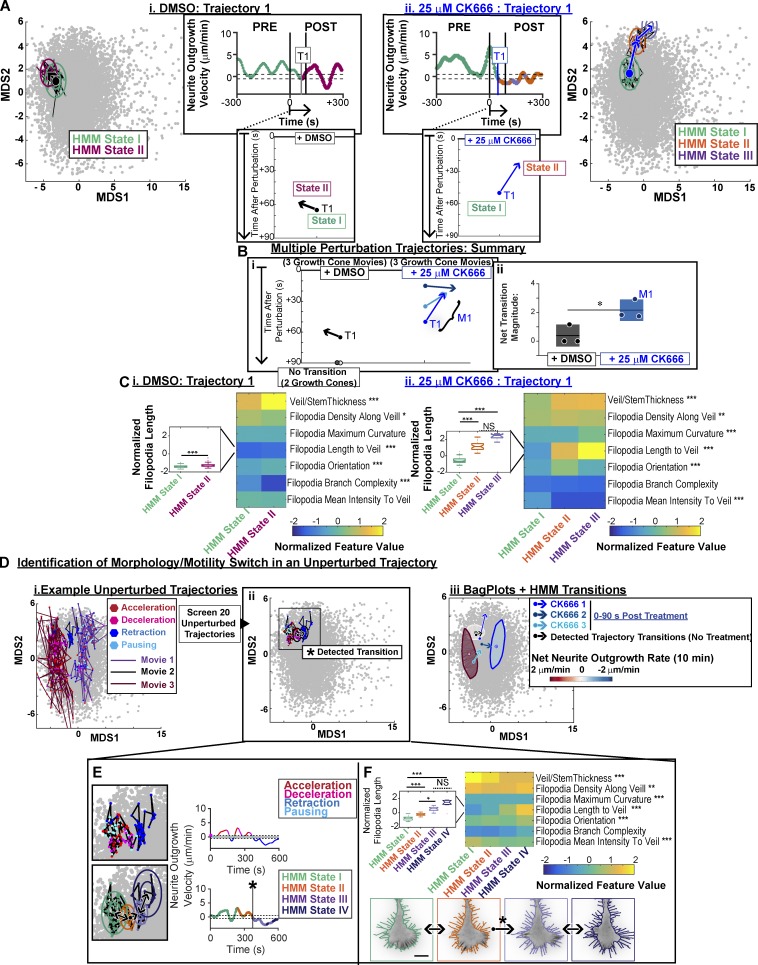
Figure 9.
Detection of significant transitions in GC morphology along a neurite outgrowth trajectory. (A) Time series modeling of a DMSO- (left and Video 9) and CK666 (right and Video 10)-treated GC movie in reduced morphology space. Colors: state ID inferred from the HMM/Bayesian model selection. Rings: 1× and 2× the SD of the state distribution centered on the mean. Bottom insets: Plot of detected transition within a 90-s window after respective treatment. (B) CK666 treatment induces reproducible GC morphology state transitions. (i) Plots of detected morphology transitions for six movies (as described in A, bottom inset) 90 s after treatment with DMSO (gray/black shaded vectors) or 25 µM CK666 (blue shaded vectors). (ii) Magnitude of the transition vectors in i. *, P < 0.05, two-tailed t test for equal means. (C) Median of feature distribution for each detected HMM morphology state detected in A (DMSO, left; CK666, right). *, P < 0.05; **, P < 0.01; ***, P <0.001: Kruskal–Wallis test. Insets: Boxplots of the distribution of filopodia lengths in each HMM state. *, P < 0.05; **, P < 0.01; ***, P < 0.001: Tukey–Kramer test. (D) Identification of morphology/motility switches in a heterogeneous population of unperturbed trajectories. (i) Three unperturbed GC movies overlaid on the morphological landscape, each frame colored by neurite outgrowth state as in Fig. 8 E, i. Identification of morphology/motility switch (starred black arrow) similar to that induced upon acute treatment with CK666 (A–C). Black rings: HMM states as defined in A. Colors as in D, i. (iii) “Bag” contours as defined in Fig. 8 D, iii, for GC movies in i. Arrows: Detected morphology state transitions from B and D, ii. Each movie: 10 min total, 5-s intervals. (E) Zoom (left) and neurite outgrowth velocity (right) of unperturbed GC movie identified in D, ii, frame colored by neurite outgrowth state (top) or HMM state ID as defined in A (bottom). (F) Feature/HMM state heat maps (as defined in C) for unperturbed movie identified in D, ii (top). Example GCA segmentations for each HMM morphology state (bottom).

