Figure 3.
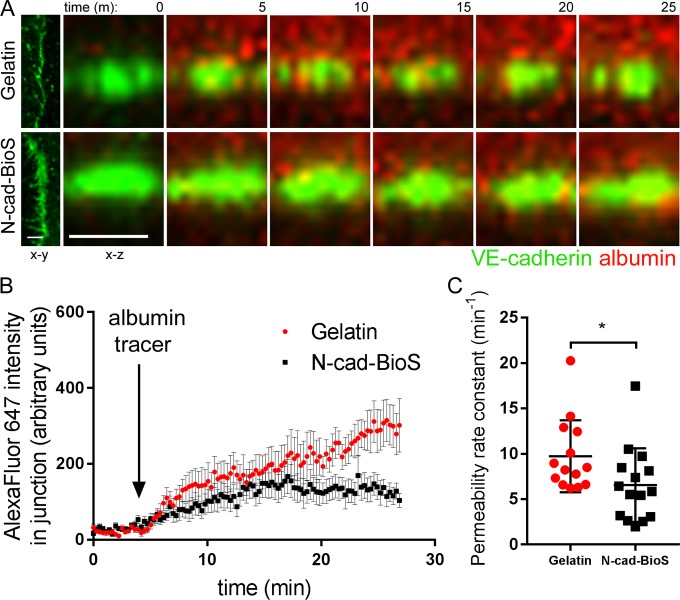
N-cadherin–activated signaling restricts junctional permeability to albumin. (A) Confocal live cell imaging of HPAECs expressing VE-cadherin–GFP (green) showing albumin–Alexa Fluor 647 (red) permeation across AJs. x-y (left) and x-z (enlarged, shown over time) sectional area of VE-cadherin–GFP junction. Albumin–Alexa Fluor 647 was added apically at 5 min. Time is shown in minutes; bar, 5 µm. (B) Measurement of average fluorescent intensity of albumin–Alexa Fluor 647 within VE-cadherin–GFP junction over time. Fluorescence was normalized to starting fluorescent intensity before addition of albumin–Alexa Fluor 647. (C) Bar graph showing the permeability rate constant from B in endothelial monolayers on gelatin and N-cad-BioS. The permeability rate constant was reduced in cells grown on N-cad-BioS as compared with gelatin. n = 14–15 junctions from three independent experiments. (B) Data are presented as mean ± SEM; (C) data are presented as mean ± SD; *, P < 0.05, a two-tailed, unpaired t test.

