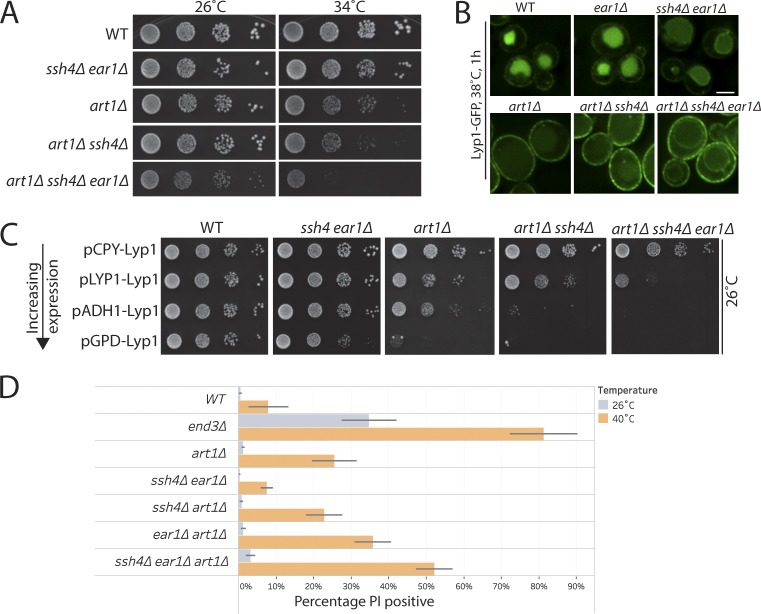
Figure 8.
Intracellular and cell surface QC systems cooperatively ensure maintenance of proteostasis. (A) 10-fold serial dilutions of WT or art1Δ, ssh4Δ ear1Δ, art1Δ ssh4Δ, and art1Δ ssh4Δ ear1Δ mutants spotted on synthetic complete medium plates and incubated at 26°C and 34°C for 3 d. (B) WT or ear1Δ, ssh4Δ ear1Δ, art1Δ, art1Δ ssh4Δ, and art1Δ ssh4Δ ear1Δ mutants expressing Lyp1-GFP exposed to heat stress at 38°C for 1 h before imaging. Scale bar: 2.5 µm. (C) Growth assay to compare the effect of Lyp1 overexpression from PLYP1, weak promoter (PCPY), or strong promoter (PADH and PGPD) in WT or ssh4Δ ear1Δ, art1Δ, art1Δ ssh4Δ, and art1Δ ssh4Δ ear1Δ mutants. Mid-log phase cultures were spotted on synthetic medium lacking uracil and incubated at 26°C for 3–5 d. (D) Flow cytometry–based cell integrity analysis measured by PI staining of WT, end3Δ, art1Δ, art1Δ ssh4Δ, art1Δ ear1Δ, ssh4Δ ear1Δ, and art1Δ ssh4Δ ear1Δ mutants at 26°C or upon shift to 40°C for 3 h. The bar graphs represent the average PI-positive fraction, and error bars indicate standard error of the measurements.

