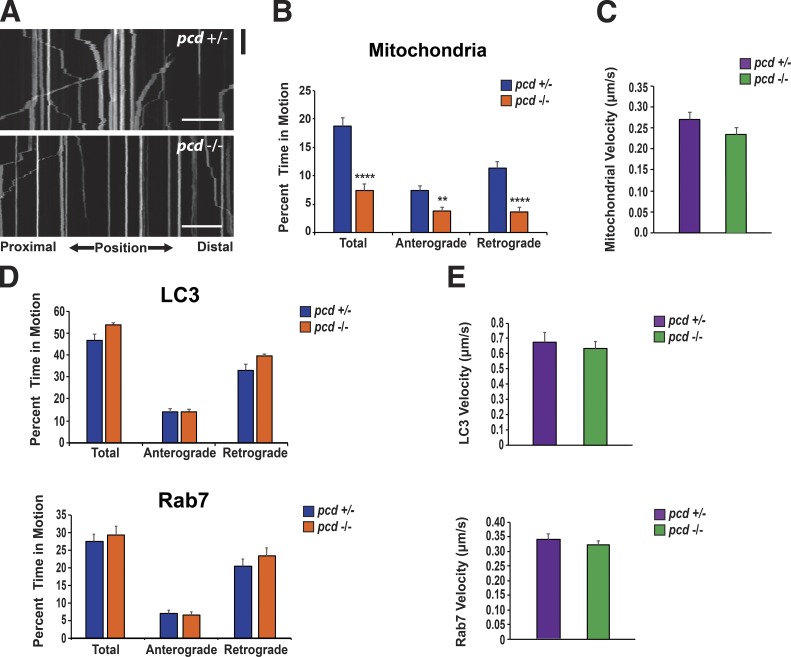
Figure 8.
Mitochondrial transport is reduced in pcd CGNs. (A) Kymograph analysis of mitochondrial movements in mito-EGFP expressing cerebellar granule cell neurons from pcd heterozygous (+/−) mice and pcd homozygous (−/−) mice. Black bar is 60 s. Bars, 20 µm. (B) Markedly increased pausing of mitochondria in cerebellar neurons from pcd homozygous (−/−) mice. Two-tailed t test: **, P < 0.01; ****, P < 0.0001. n ≥ 25 axons per genotype. (C) Mean velocity of mitochondria in cerebellar neurons from pcd heterozygous (+/−) mice and pcd homozygous (−/−) mice. (D) Results of kymograph analysis of LC3 movement and Rab7 movement in cerebellar granule cell neurons from pcd heterozygous (+/−) mice and pcd homozygous (−/−) mice, expressing either LC3-GFP or Rab7-GFP. Movements of LC3 and Rab7 were similar in pcd+/− and pcd−/− neurons. For LC3-GFP, n = 28 axons per genotype. For Rab7-GFP, n ≥ 15 axons per genotype. (E) Mean velocities of LC3 and Rab7 in cerebellar neurons from pcd+/− and pcd−/− mice. Two-tailed t test: P = NS. Error bars are SEM.

