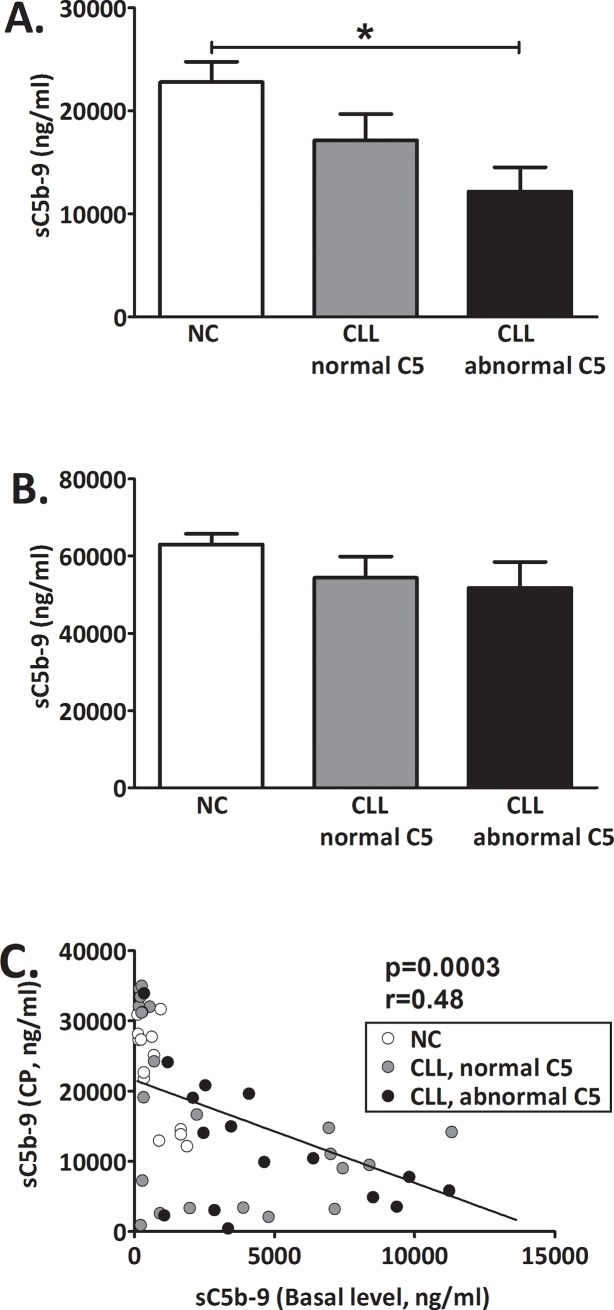
Fig 3. Complement activation in-vitro.
C was activated in-vitro via the CP by aggregated IgG (A) or via the AP by Zymosan (B) and levels of sC5b-9 were determined. Basal sC5b-9 levels were subtracted. Values are given as mean with SEM. NC (white bars): n = 13; CLL with normal C5 (grey bars): n = 23; CLL with abnormal C5 (black bars): n = 16. *p = 0.002 vs. NC. (C) The correlation between sC5b-9 levels at baseline and after CP activation was analyzed in all subjects. NC (white circles): n = 13; CLL with normal C5 (grey circles): n = 23; CLL with abnormal C5 (black circles): n = 16.

