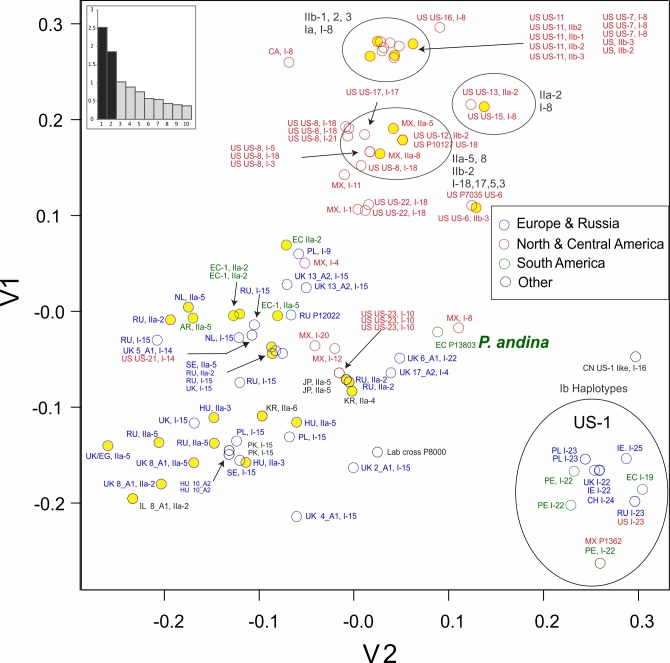
Fig 4. PCA of SSR data for Phytophthora infestans showing relationship of geographic location of recovery, clonal population (where known) and mitochondrial haplotype.
Yellow circles represent haplogroup II mitochondrial types. The eigenvalue score plot indicates the variance accounted for the first ten principal components.

