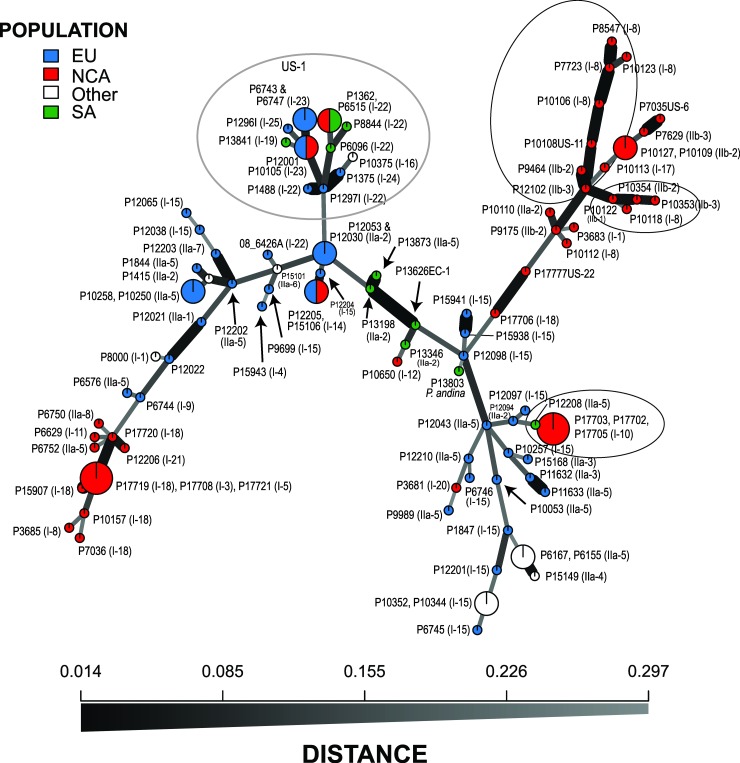
Fig 6. Minimum spanning network of SSR data for Phytophthora infestans showing isolate accession number, location of recovery and mitochondrial haplotype indicated in the brackets.
Circled areas represent the branch of US-1 isolates or portions of the analysis where closely affiliated isolates based on SSR analysis have different mitochondrial haplotypes.

