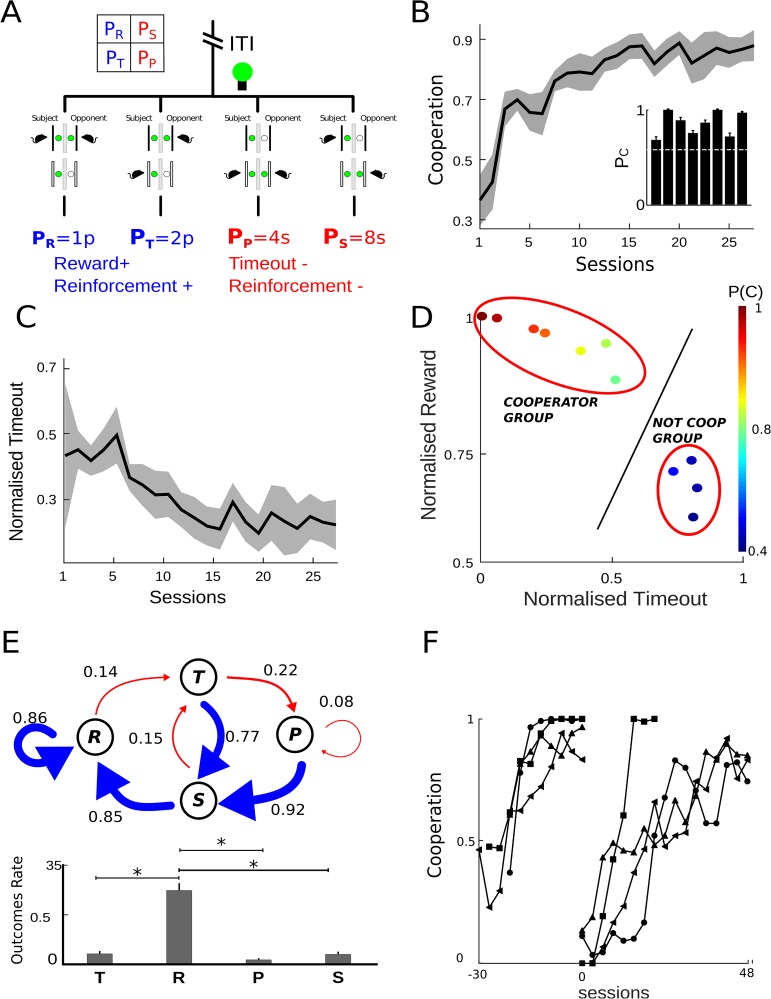
Fig 1. High level of cooperation in iPD.
(A) Dual operant box diagram and the matrix with positive(blue) and negative(red) reinforcement is shown. The iPD game had four possible states: R(reward) mutual cooperation, P(punishment) mutual defection, T(temptation) in which subject defected and opponent cooperated and S(sucker) subject cooperated and opponent defected. The opponent´s light was driven in order to perform a Tit for tat strategy. (B,C) Time-course of cooperation and timeout rate along the last 23 games sessions. In the last 5 sessions, the mean ± sem of cooperation was 0.86 ± 0.05 and timeout was 0.23 ± 0.08. (D) Total reward versus timeout for all animals (color bar means cooperation mean). Each animal was compared with the regression line fit to a population with cooperation level set to 60% (black continuous line). The higher the cooperation levels, the larger the total reward and the lower the total timeout. (E) Markov Chain diagram shows the probabilities of transition between states (p(c|T−1) = 0.76, p(c|R−1) = 0.85, p(c|S−1) = 0.93, p(c|P−1) = 0.87). The arrow represents transitions: driven by cooperation in blue, and driven by defection in red (the arrow thickness is proportional to transition probability). Below, bars show occupancy ratio when cooperation reaches stability. Probabilities were: p(R) = 0.76, p(T) = 0.1, p(P) = 0.04, p(S) = 0.1. Asterisks denote significant differences from multiple comparisons using one-way ANOVA and Bonferroni correction. (F) Evolution cooperation rate before and after reversal. Graphs show a moving average with samples of 3 sessions (the mean and sem from reversal on the last five sessions was 0.87 ± 0.04).

