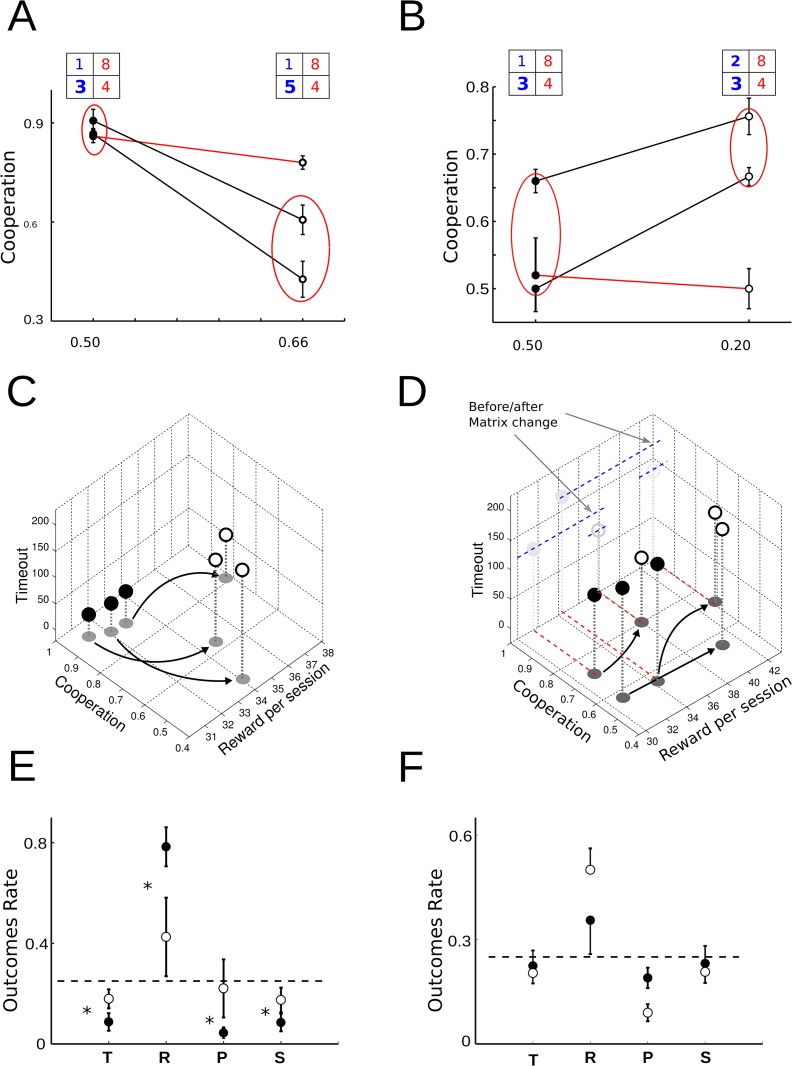
Fig 2. Effect of changes in the amount of positive reinforcement of R and T.
(A) The rats were pre-trained by pay-off matrix [PR = 1, PT = 3, PP = 4, PS = 8 and contrast ] (filled dots) and the cooperation was strongly affected by change of temptation payoff, decreasing when T payoff increased and matrix with changed to [R = 1, T = 5, P = 4, S = 8 and contrast ] (open circles). There was a significant difference (red circle) in two animals with p < 9.8e−06 (wilcoxon rank-sum test) and the other did not modify her behavior in spite of matrix change. (B) The cooperation enhanced when the matrix changed to [R = 2, T = 3, P = 4, S = 8 and ] (open circles) and the difference was statistically different (p < 0.0062) in two of three subjects, because one had no significant difference after matrix change, p > 0.05(cooperation: 0.7063). (C) The 3D plots related cooperation, reward and timeout. In the group of cooperative animals (filled dots), the change in T (3 pellets to 5 pellets) increased both timeout and reward in order to decrease cooperation (open circles). The comparison between cooperation mean of both groups was significantly different, p < 0.05. (D) In the group of non-cooperative animals (filled dots), they learned to cooperate (open circles) by receiving more reward without significant changes in total timeout. The cooperation was significantly different, p > 0.05. (E,F) The mean of occupancy state rate graph (last five sessions) from cooperative (left) and non-cooperative (right) groups (Mean ± sem). Asterisks denote significant difference, after matrix changed, among T, R, P or S state occupancy and dash line indicates the level of equal rate in each state (that corresponds to a strategy with strongly random component). Before changes (filled dots) and after changes (open circles).

