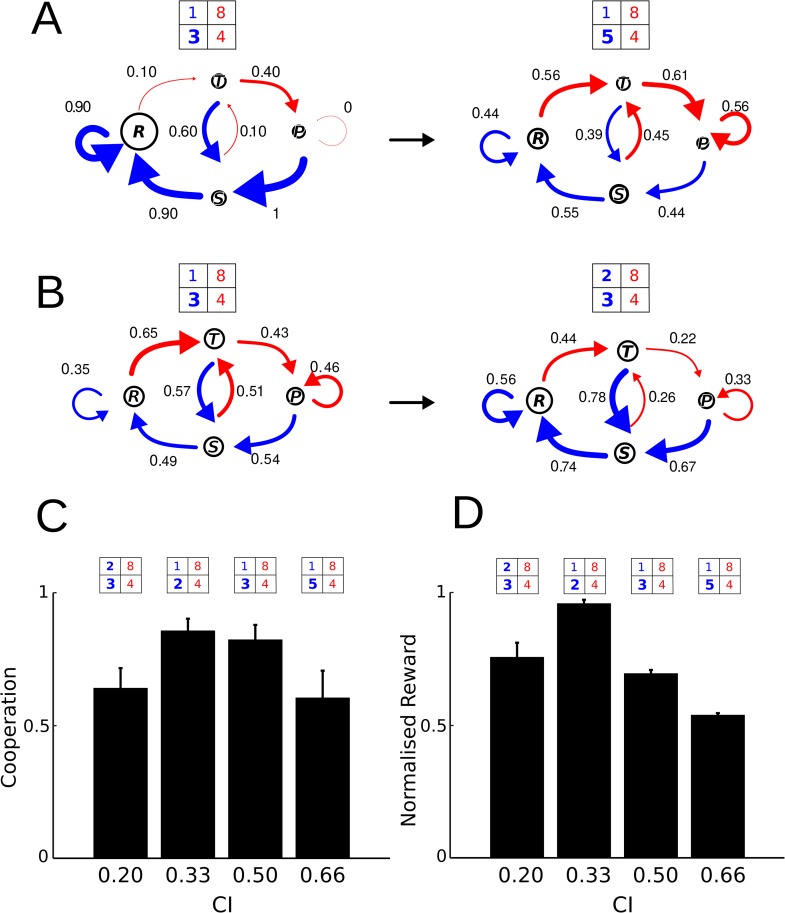
Fig 3. Markov chain diagrams and contrast index.
Markov chain diagrams are shown (the size of circle means of occupancy state rate and the arrow’s width are proportional to the probability of cooperate given (A) occupancy state and transition probabilities for an animal that disrupted its cooperative behavior when contrast index was changed to and pay-off matrix was changed [PT, PR, PP, PS] = [3p, 1p, 4s, 8s] to [5p, 1p, 4s, 8s] (p = pellet and s = seconds). The thickness of blue arrows (conditional probabilities of cooperation) become thinner after change (for values see Table 1). (B) The opposite situation can be seen, non-cooperative animal becomes more cooperative when was decreased to in a matrix that favors cooperation. The blue arrows become thicker after change (for values see Table 1). (C, D) shows cooperation and timeout levels as a function of CI. Here, it can be seen that both variables follow an inverted U profile in correlation with the contrast index increase and if the payoff matrix favors or not the cooperation behavior.

